
A walkthrough of Gaia Carbon Accounting
Every image on this page is a real screen from the product, in the order you would meet it: get the data in, understand what it says, turn it into the reports people ask for, then cut emissions and prove all of it.
Press play for the whole journey, then read on for the detail
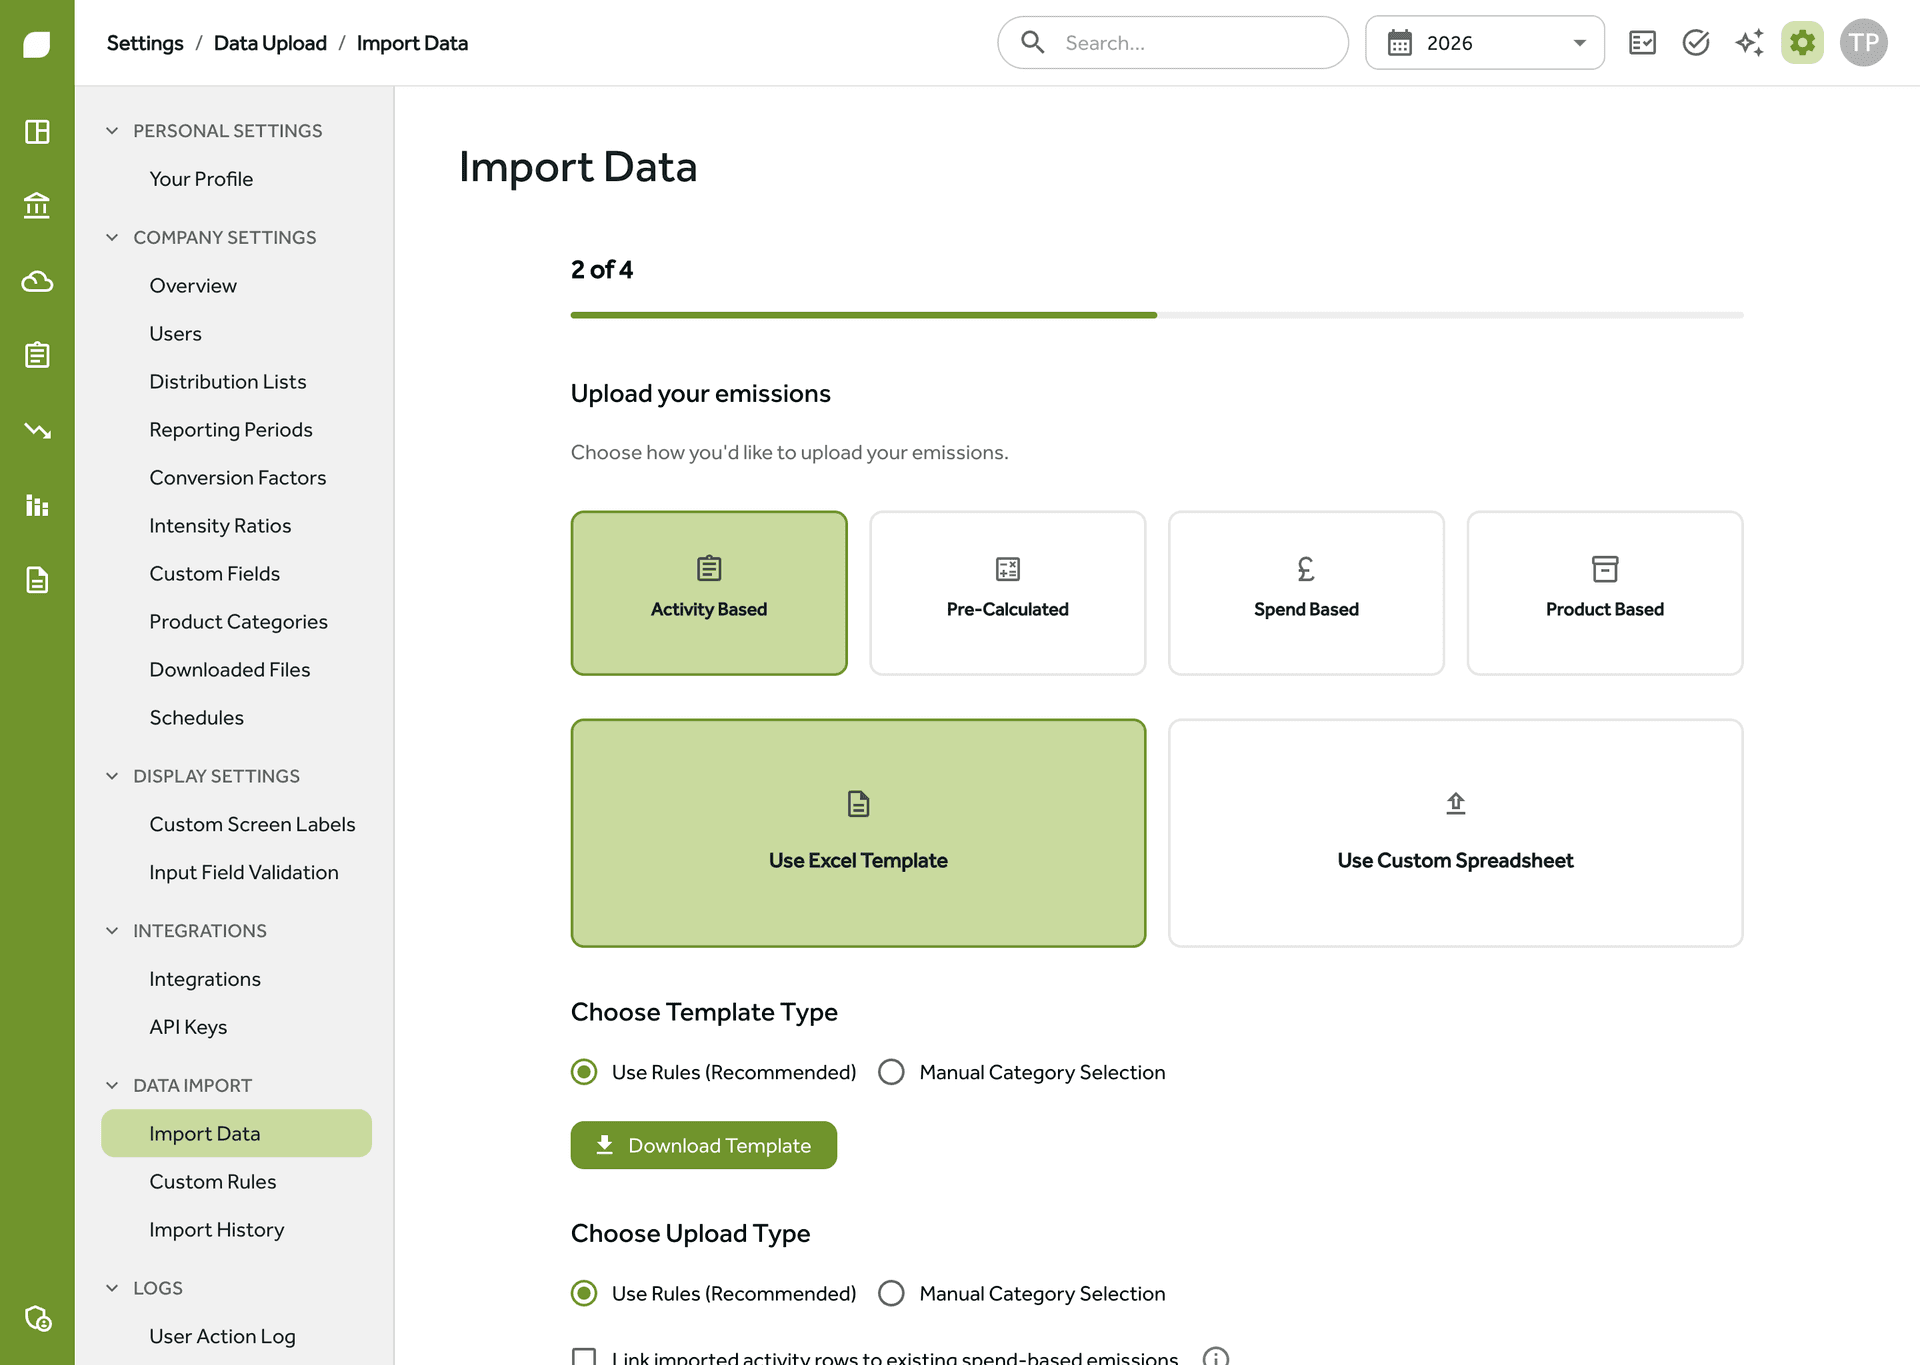
Every route in validates before anything counts
Spreadsheets, accounting integrations, bill extraction or the API: the import wizard checks every row and says exactly what failed and why, so you fix the file instead of hunting through it. See the full walkthrough
Measure: get the data in
Most carbon projects stall at data collection. Gaia gives you several routes in, and every route validates before anything counts towards your footprint.
Imports that say exactly what failed and why
Drop in spreadsheets of activity, spend, vehicle, goods and site data and the import wizard validates every row before anything is saved. A rejected row is never a mystery: each one states its reason, so you fix the file instead of hunting through it. And when a line in your file needs a specific emission factor, teach the platform the mapping once; the rules engine applies it to every future import automatically.
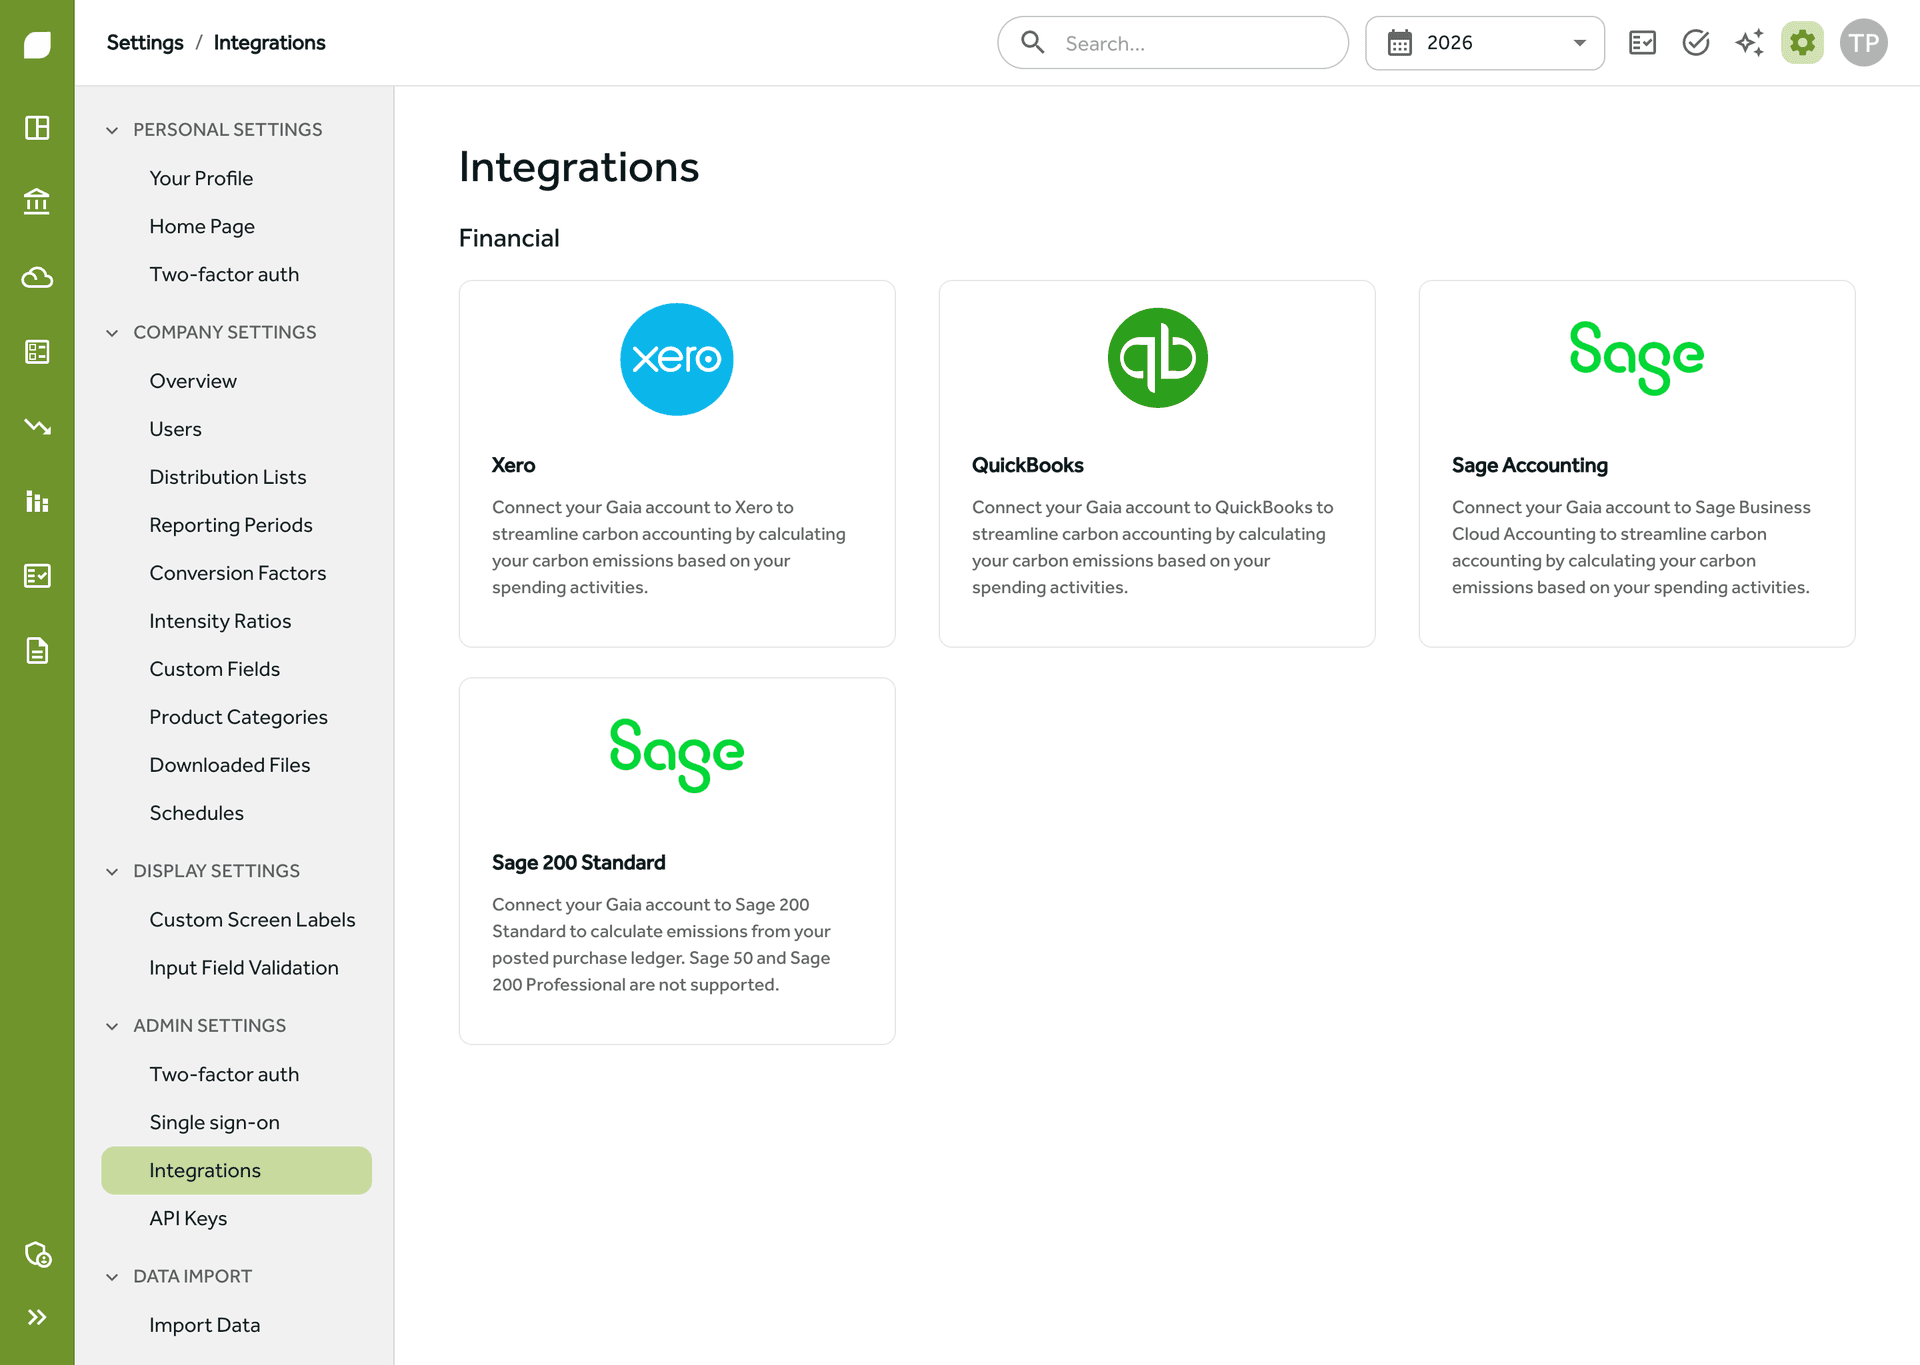
Connect Xero, QuickBooks or Sage
Connect your accounting package and spend data arrives ready for spend-based Scope 3. You map each nominal code in your chart of accounts once (to an activity, to a category group, or excluded) and every future import categorises itself. Wages, VAT and depreciation can be excluded so they never inflate the footprint, and a changed mapping applies to future imports only: history is never quietly rewritten. Spend figures are inflation-adjusted per currency using CPI, in line with GHG Protocol Scope 3 guidance, with every adjustment reasoned and auditable. Accounting integrations are included on the Pro and Enterprise plans; see pricing.



Bills read for you, confirmed by you
Upload a PDF or a photo of an electricity, gas or fuel bill and the platform reads the consumption out of it. Nothing counts until a person confirms the suggestion: it is suggest-then-confirm, never a silent write. The document itself stays attached to the emission as audit evidence, and processing happens in the UK (London region). This is deliberate document extraction of what the bill actually says, not a chatbot guessing numbers, and it currently covers English-language energy and fuel bills.
Every site on the register, even the ones without bills
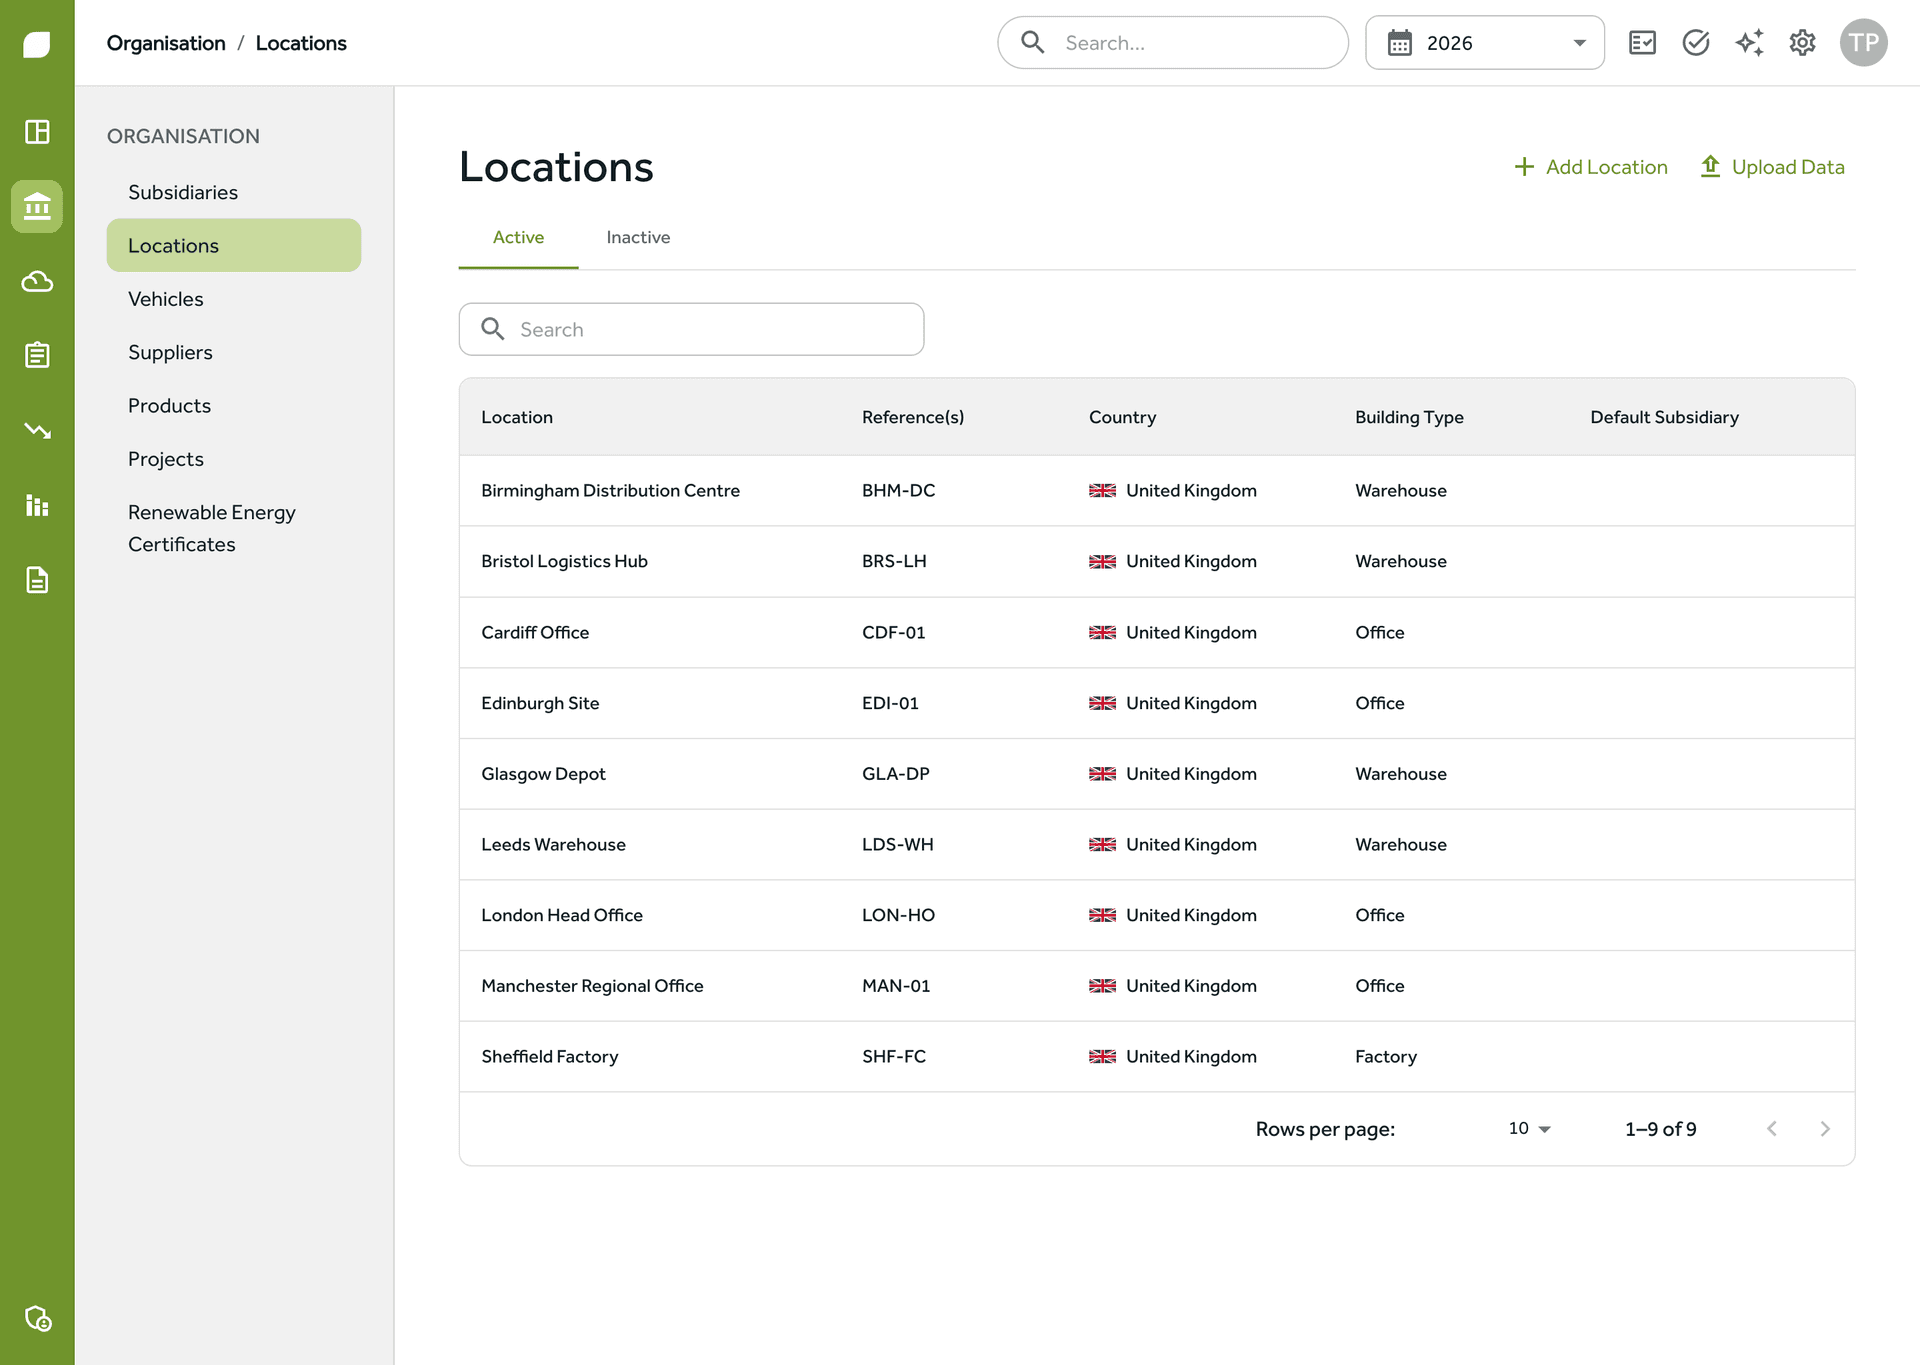
Locations keep a multi-site footprint organised by the places that create it, so each site's energy and activity data has somewhere to live. For a site with no bills yet, floor-area estimation calculates energy from occupied floor area and building type; the figure is always flagged as estimated and is superseded the moment metered data arrives. No gap, and no pretending an estimate is a meter reading.
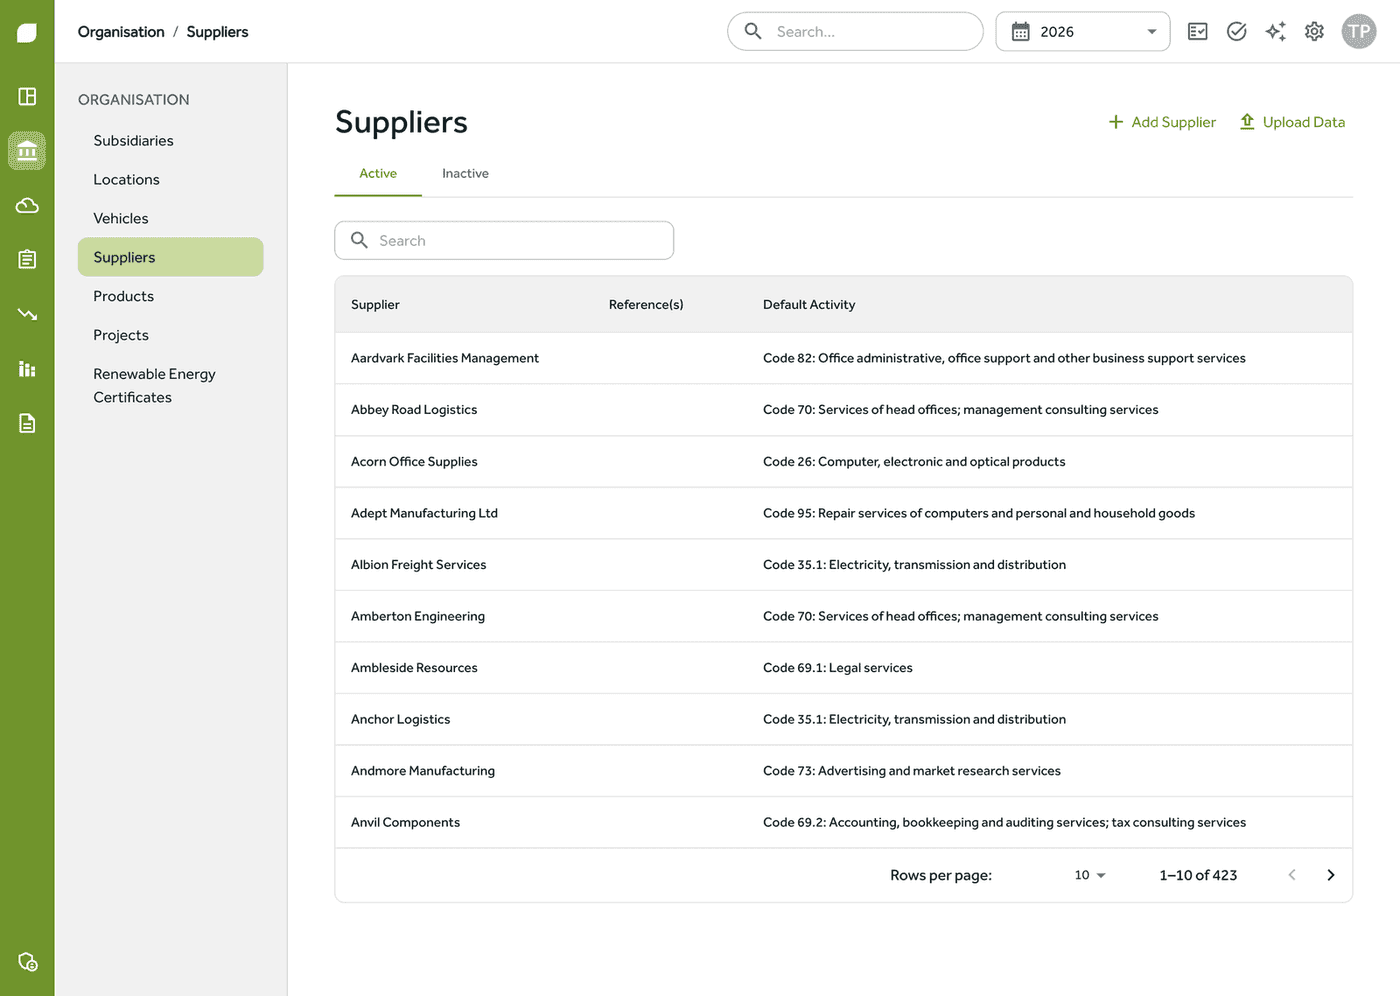
A supplier register that knows who your suppliers are
Type a supplier's name and the platform matches it against Companies House data and picks the right DEFRA spend factor for what that company does. Uncertain matches are flagged for review, never silently confident. When you want better than spend-based figures, invite suppliers straight from the register: their responses are attributed back to them, and a coverage percentage shows how much of the register has real data behind it.
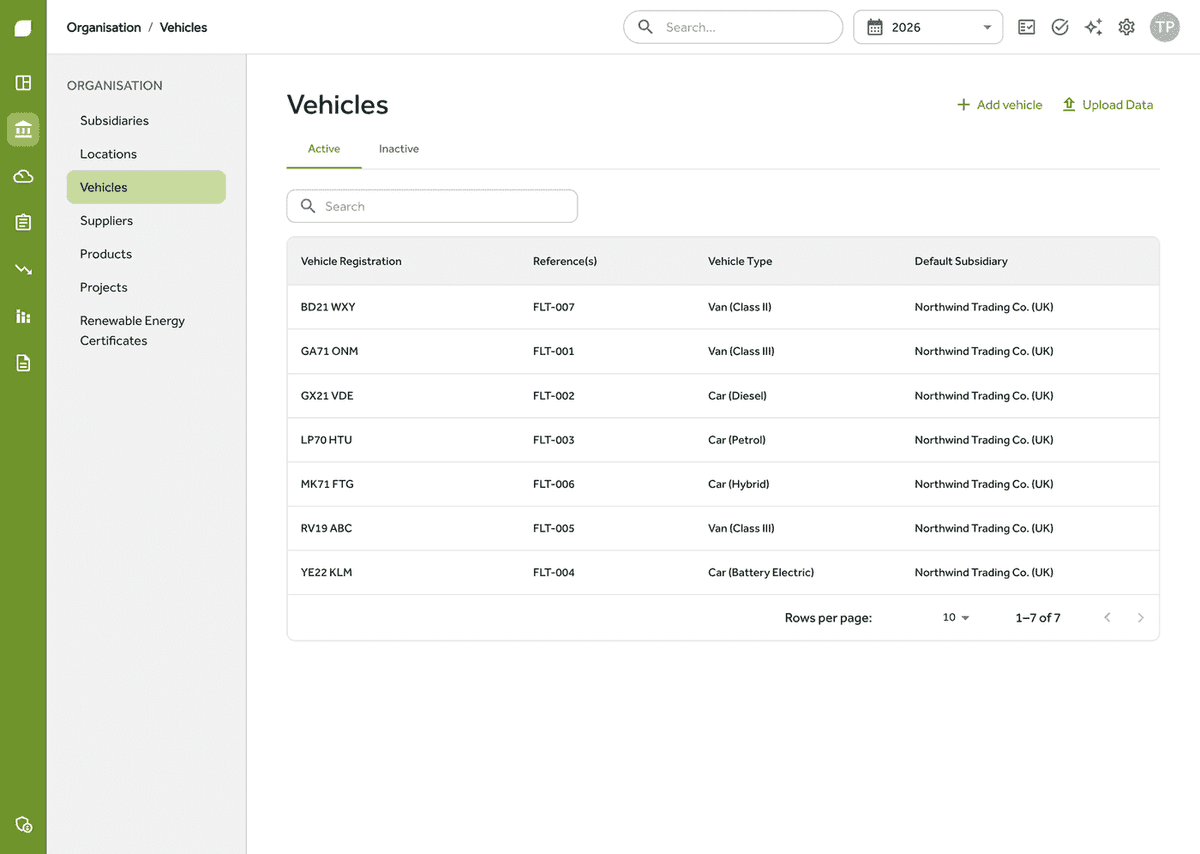
Fleet, fuel and mileage in one register
The vehicle register holds each vehicle with its type and fuel, so mileage and fuel records land against the right DEFRA factor without re-entering the details every time. Well-to-tank upstream emissions are generated automatically alongside the direct figure, so the footprint of a litre of diesel is complete rather than flattering.
Analyse: understand the number
Once the data is in, the job is understanding it: where the carbon is, how solid each figure is, and what to improve next.
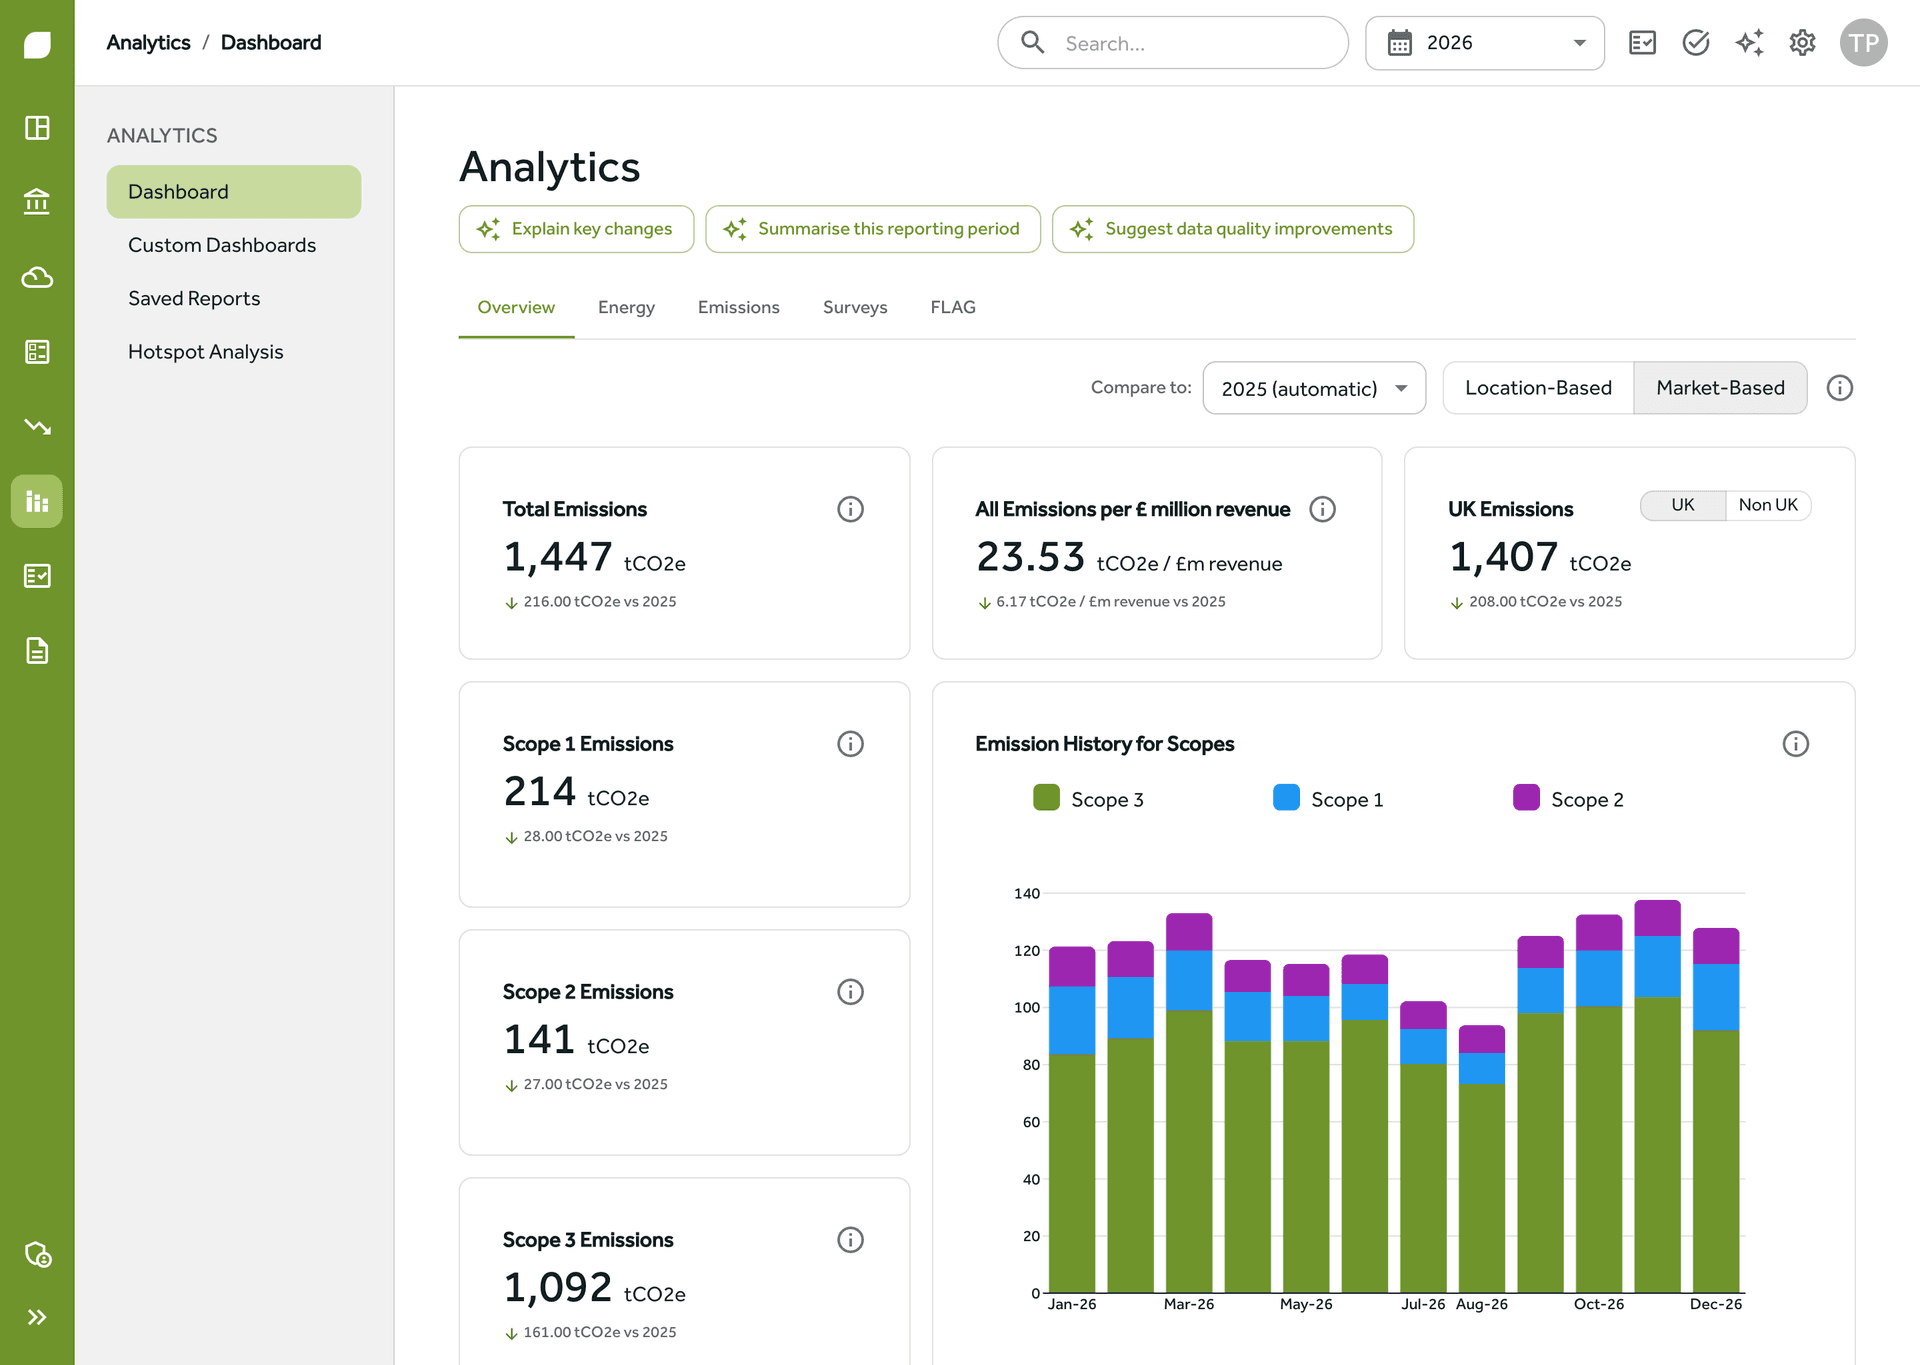
One picture of the footprint, always current
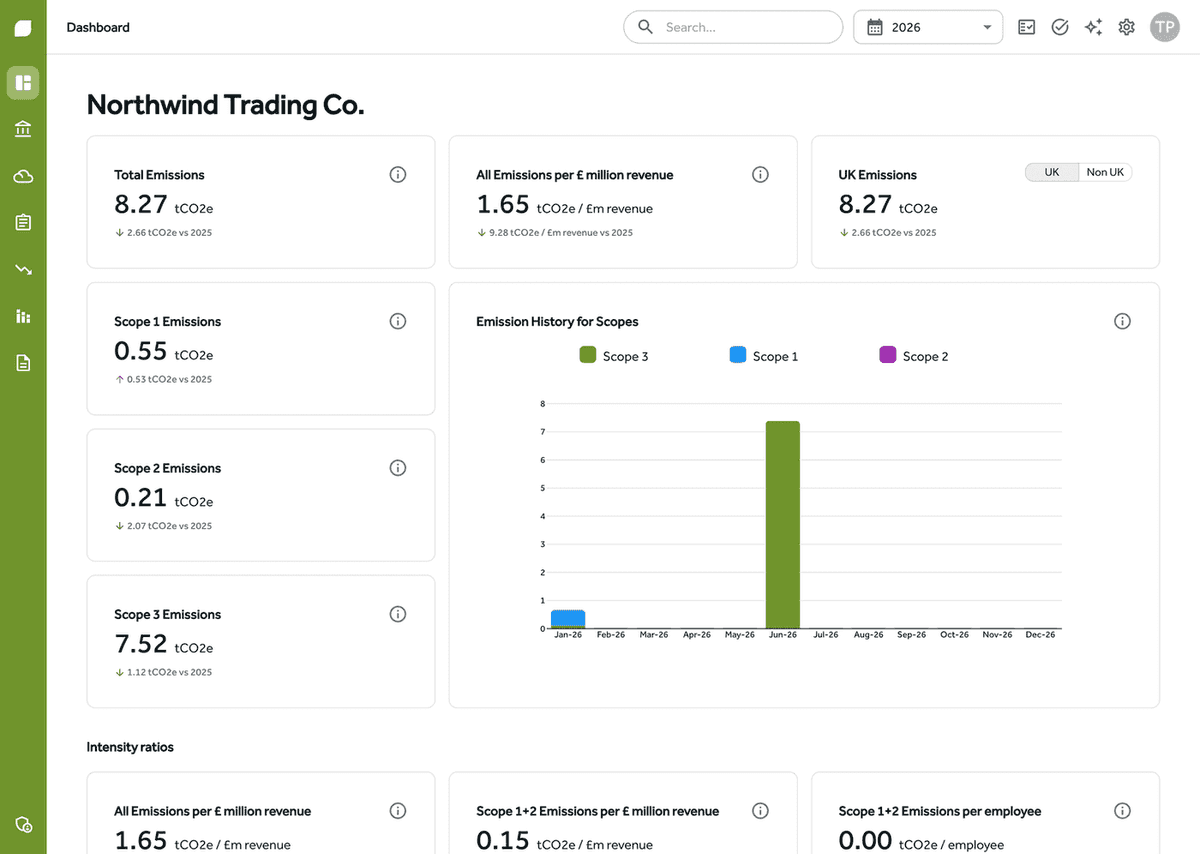
The dashboard shows the footprint by scope and over time, with the data-quality mix alongside, so you see how solid the numbers are as well as how big. Every chart reads the same calculation engine as the reports, so the dashboard and a report generated from the same period tell one story, not three near misses to reconcile before a board meeting.
Find the emissions worth attacking first
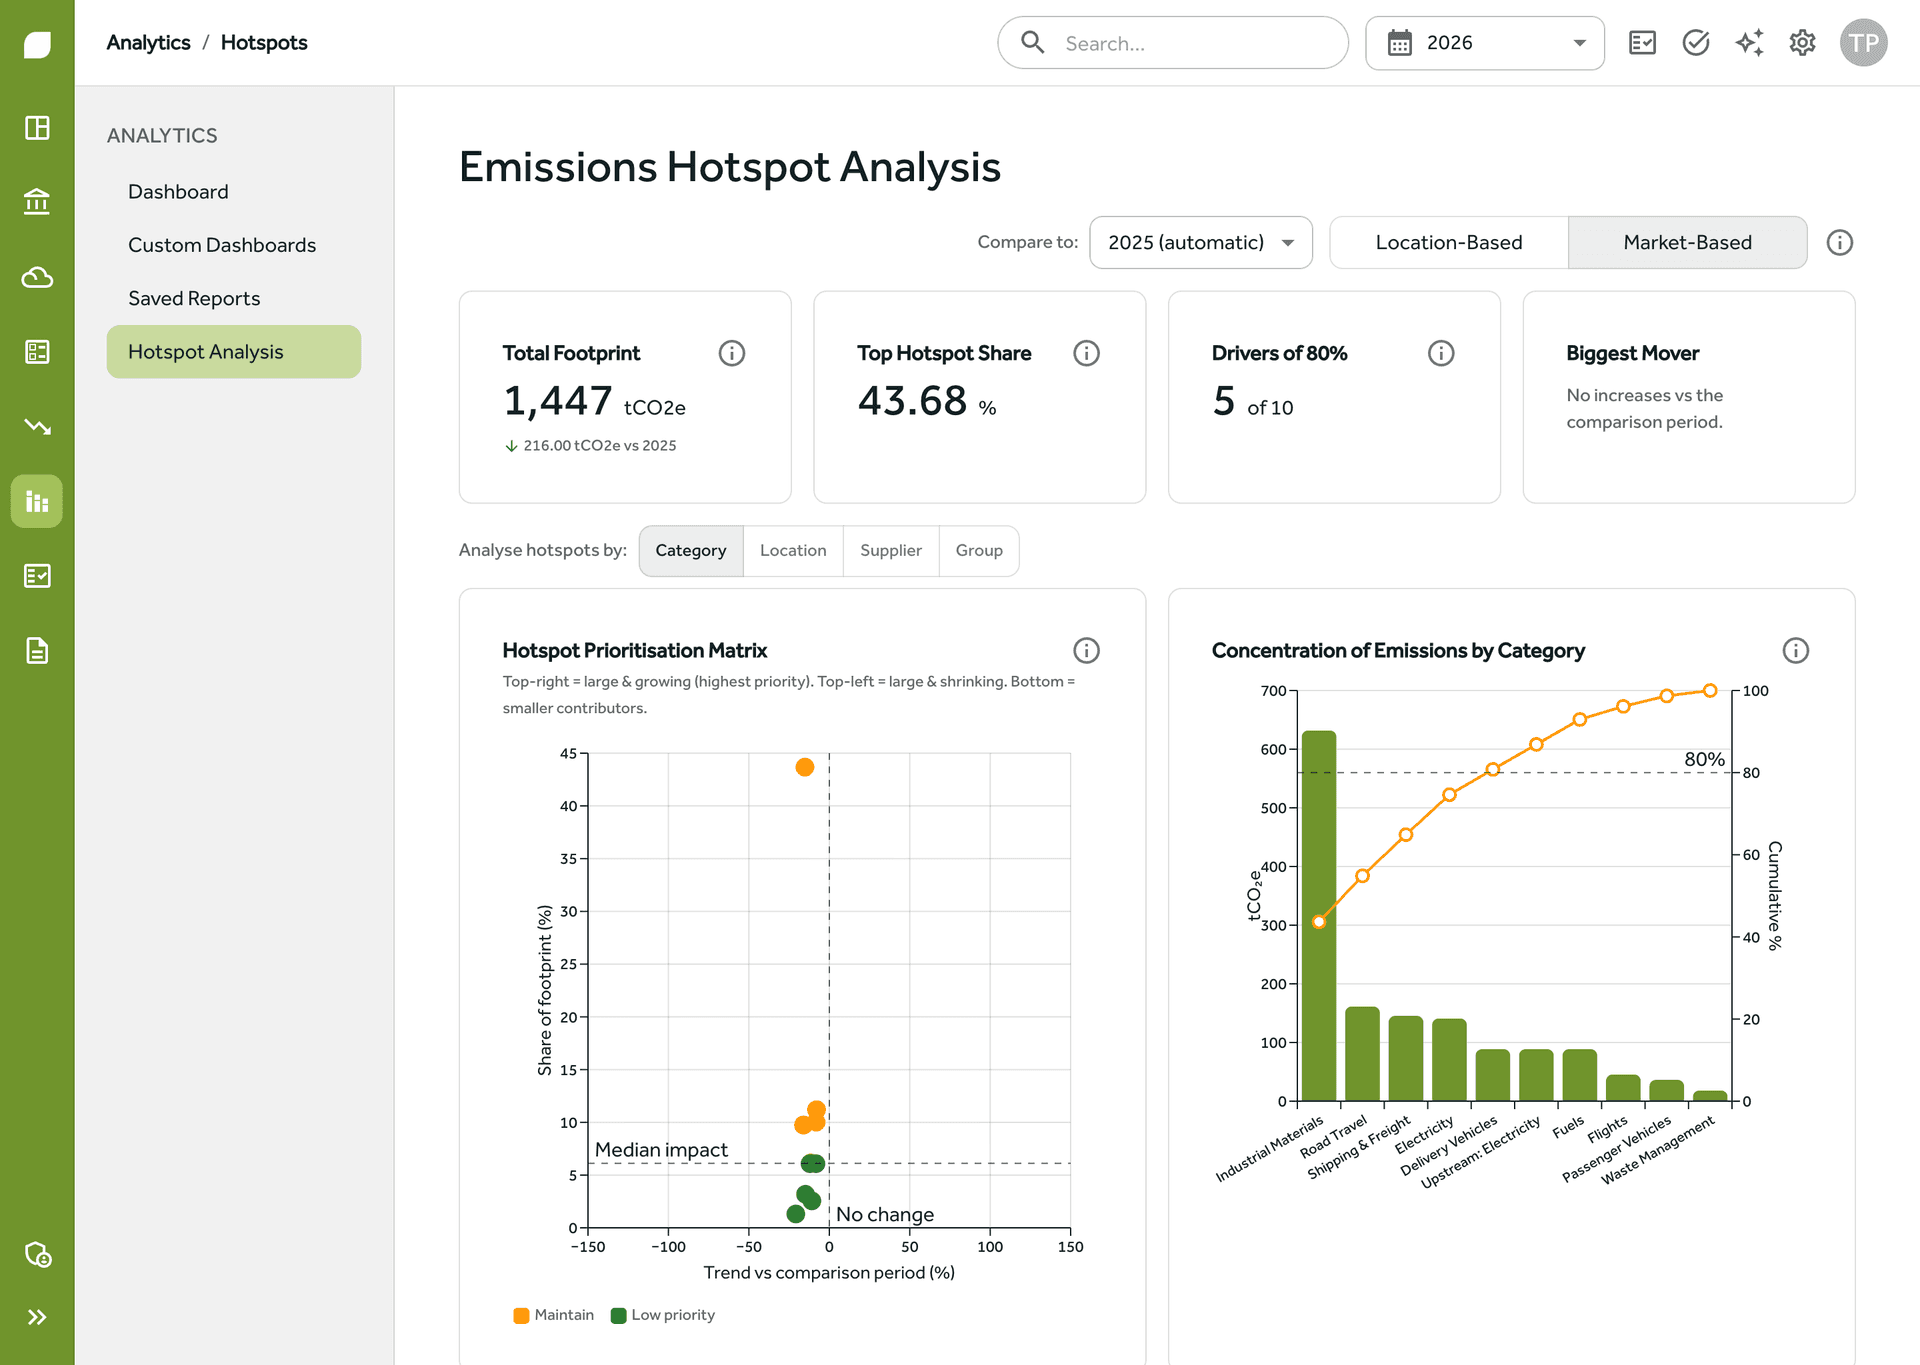
Hotspots rank where the carbon is concentrated, so reduction effort goes where it will count. Open any figure and it explains itself: the emission lines behind it, the factors applied and the evidence attached. "Why is this number so big?" gets answered in the meeting, not parked for an analyst.
A method mix, not a made-up accuracy score
Every figure carries its method from the GHG Protocol hierarchy: supplier-specific, hybrid, average-data or spend-based. Gaia aggregates that mix per report and per scope and shows it in the reports themselves, on the dashboard and in the partner client book. It is deliberately a composition of methods rather than an invented accuracy percentage, and it shows exactly which categories to upgrade next from spend to activity data.
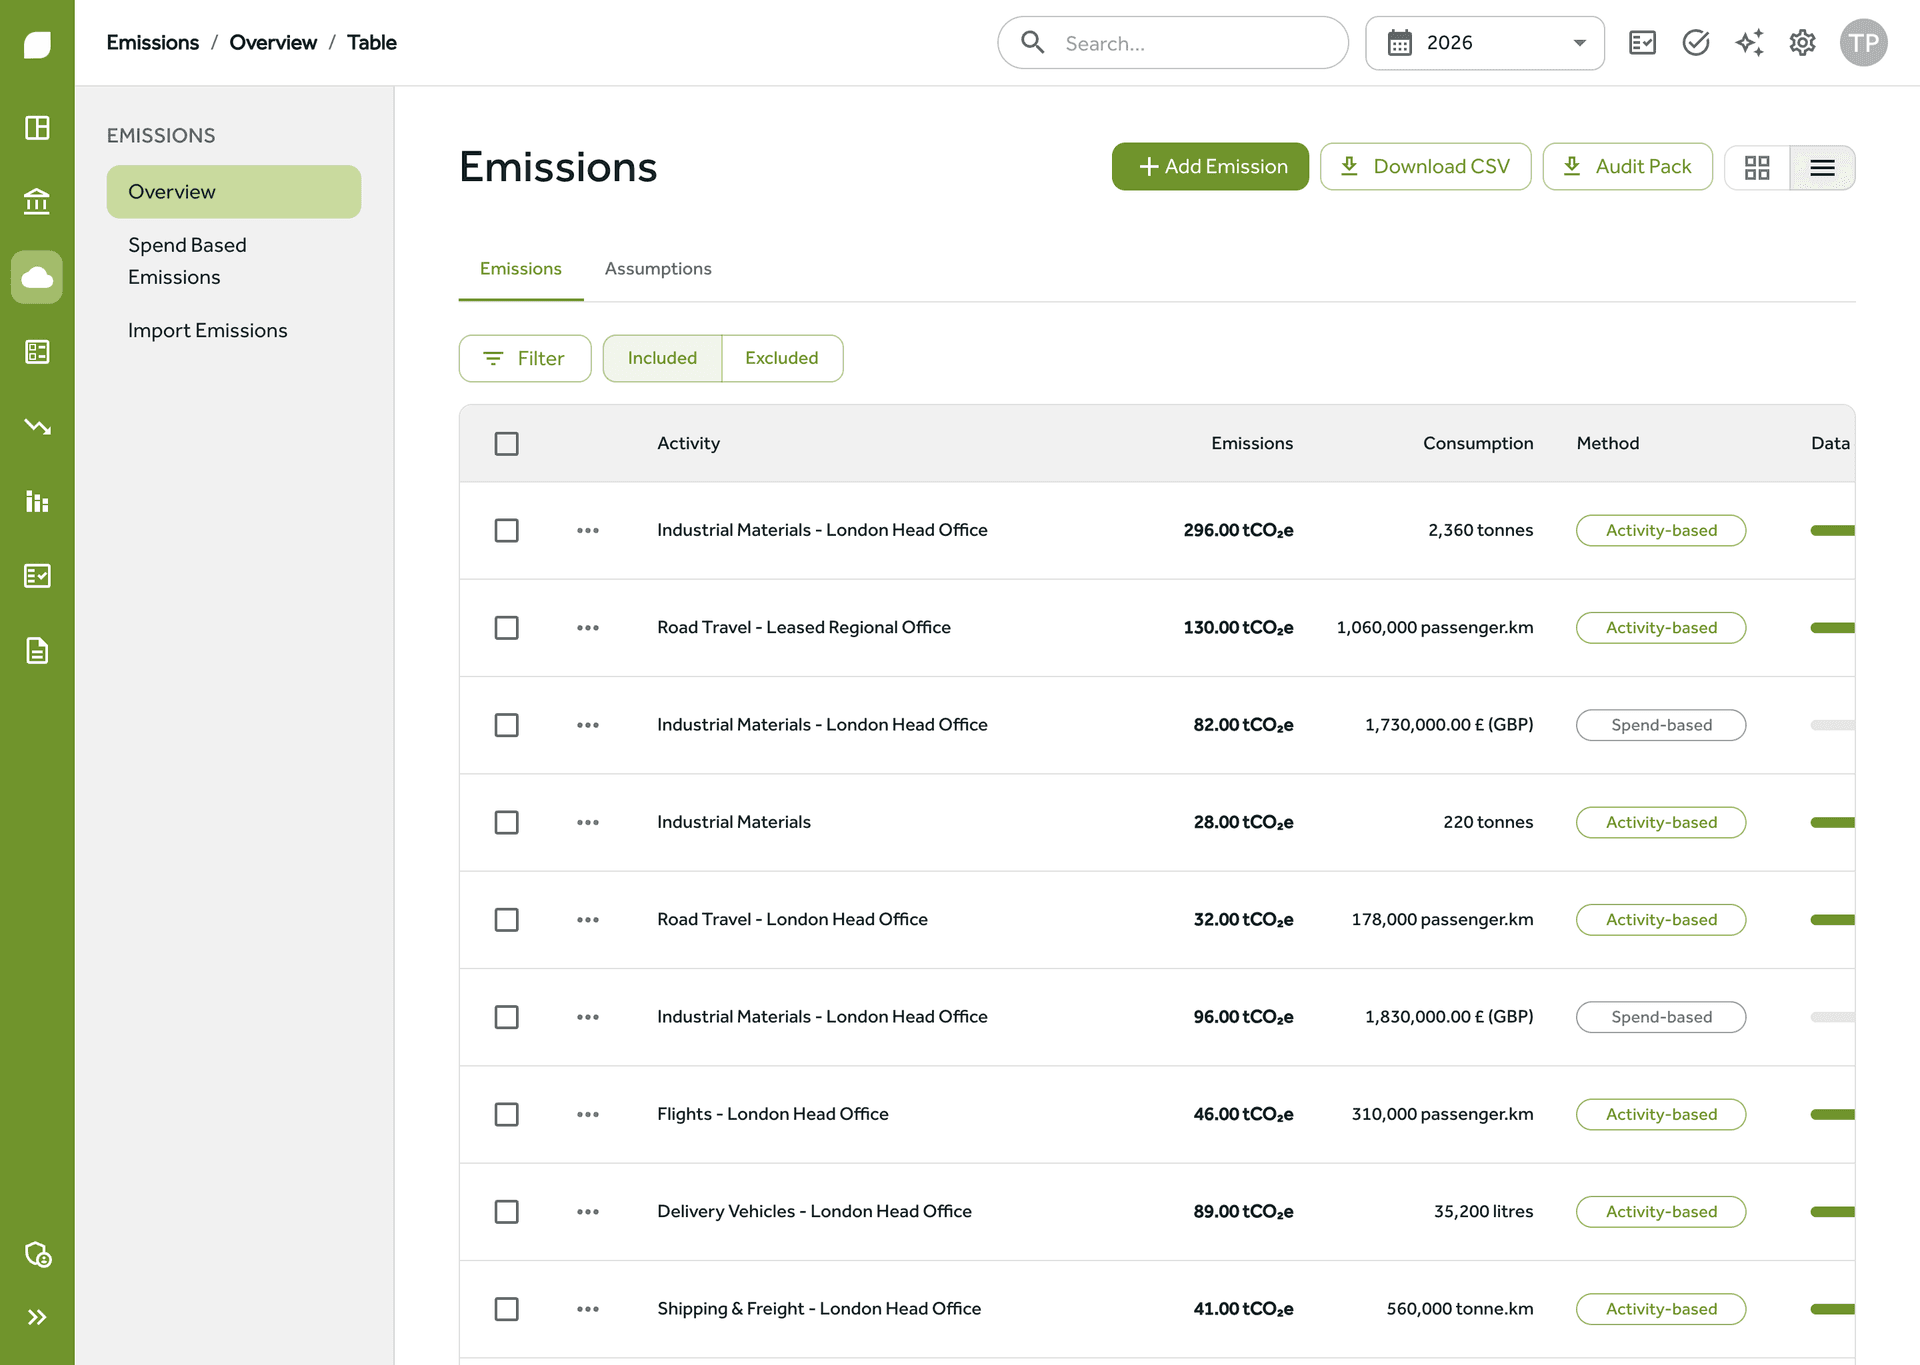
Report: the documents people ask you for
One set of measured numbers feeds every report, so the figure in your accounts, your bid and your disclosure is the same figure.
Every report, one set of numbers
All reporting draws on the same measured data: SECR, GHG Protocol, the PPN 006 Carbon Reduction Plan, a UK SRS climate disclosure built on IFRS S2's four pillars, CSRD/ESRS E1 for UK companies with EU exposure, and B Corp environmental figures. Every heading and paragraph of a report is editable per report, with the default restored when you clear an edit. Reports can be published as shareable web pages with revocable links, and they carry your organisation's logo, or the partner's brand end to end for consultancies running client books through the partner programme.
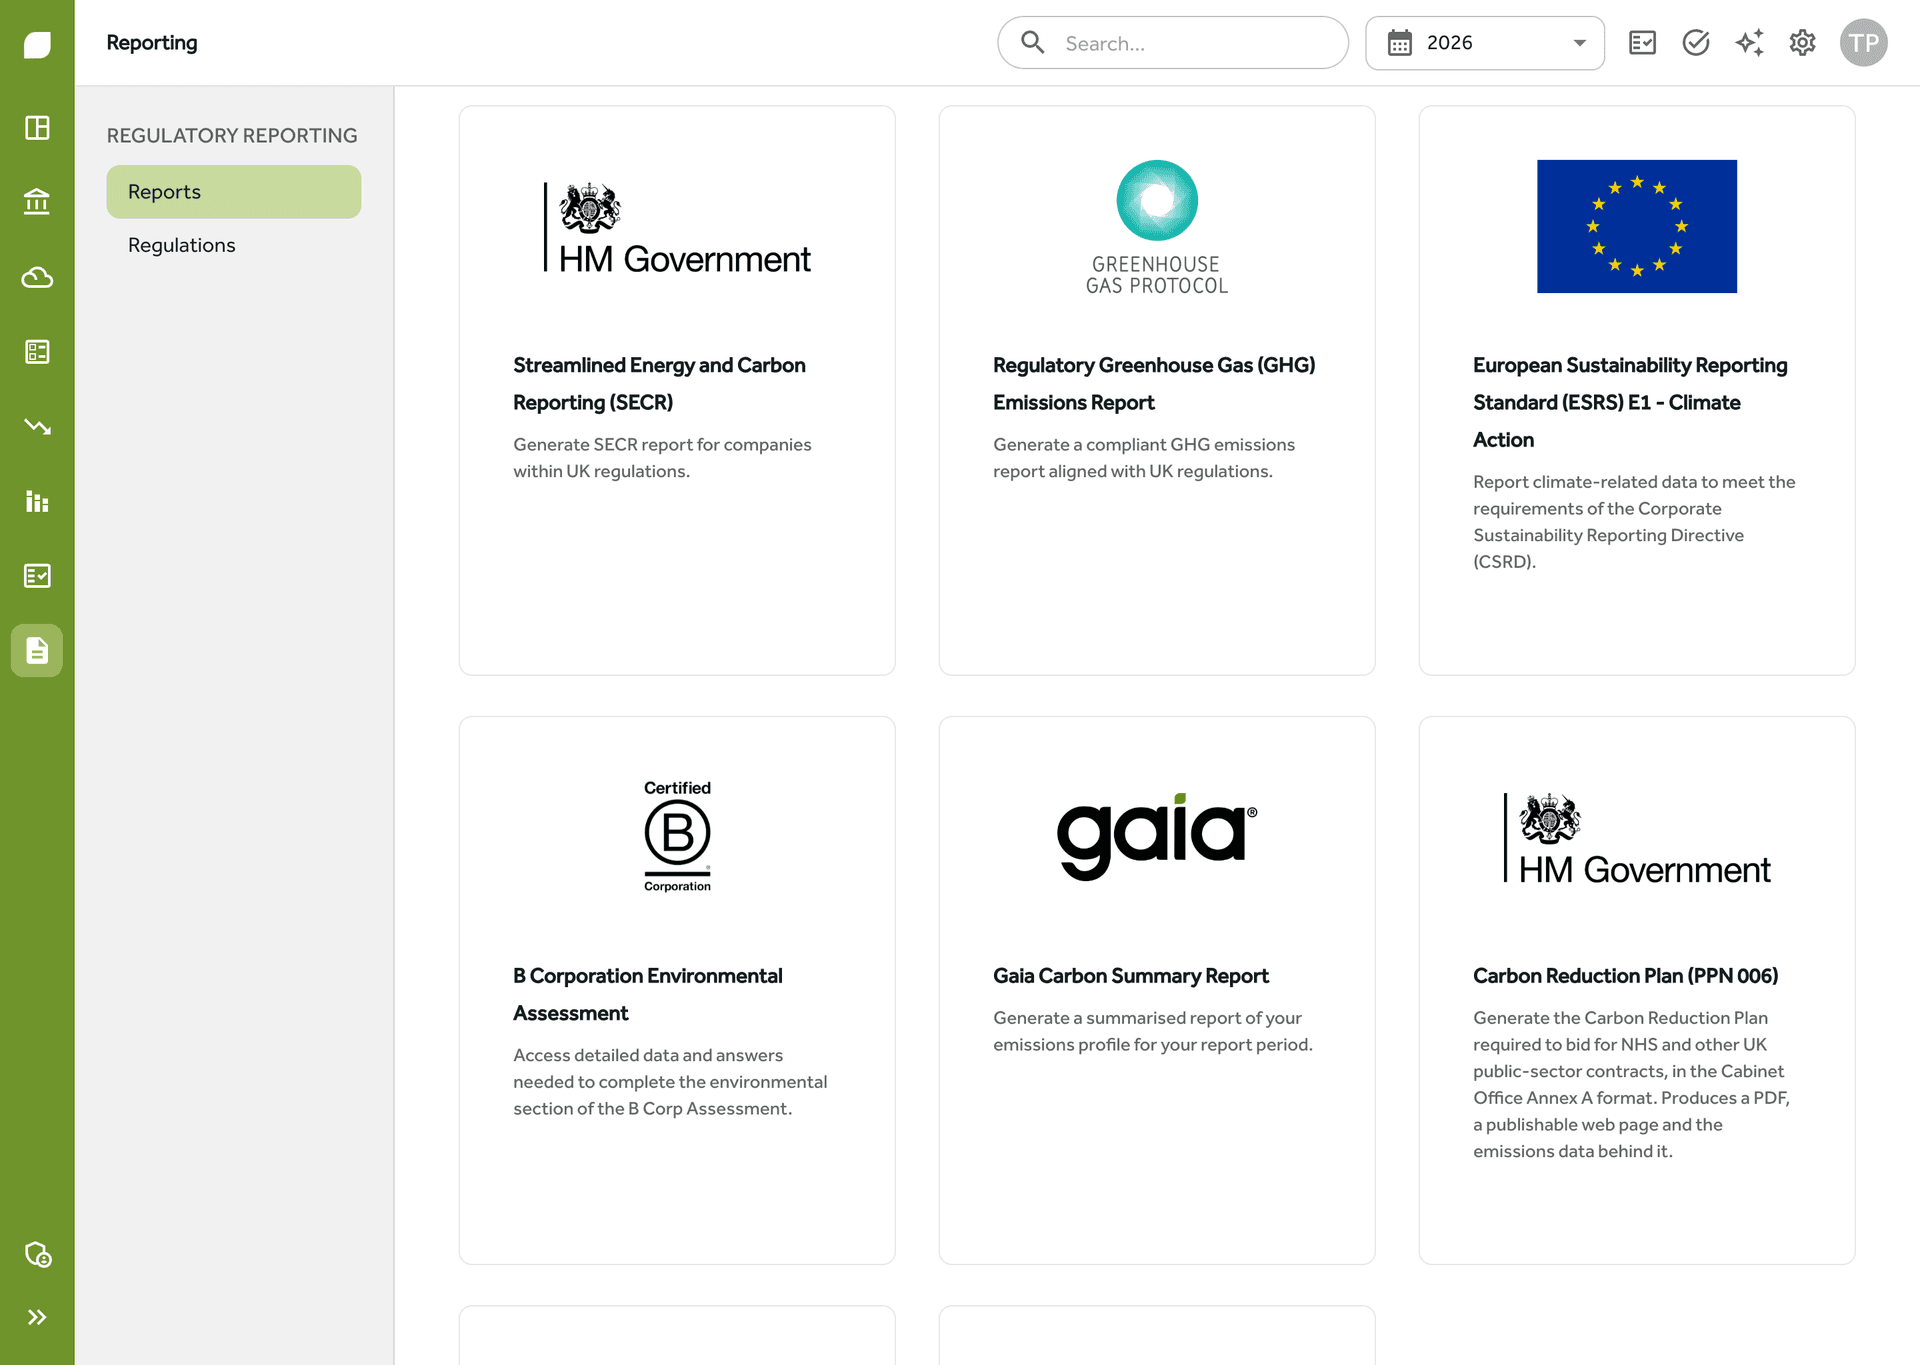
The statutory report, ready for the accounts
The SECR report carries the statutory content with the energy reconciliation, intensity ratios, comparison years and methodology narrative, plus a supplementary annex with the data-quality mix, assumptions and reduction disclosures. There is a print sign-off block for the director who puts their name to it. The SECR reporting page covers who has to report and what the rules require.
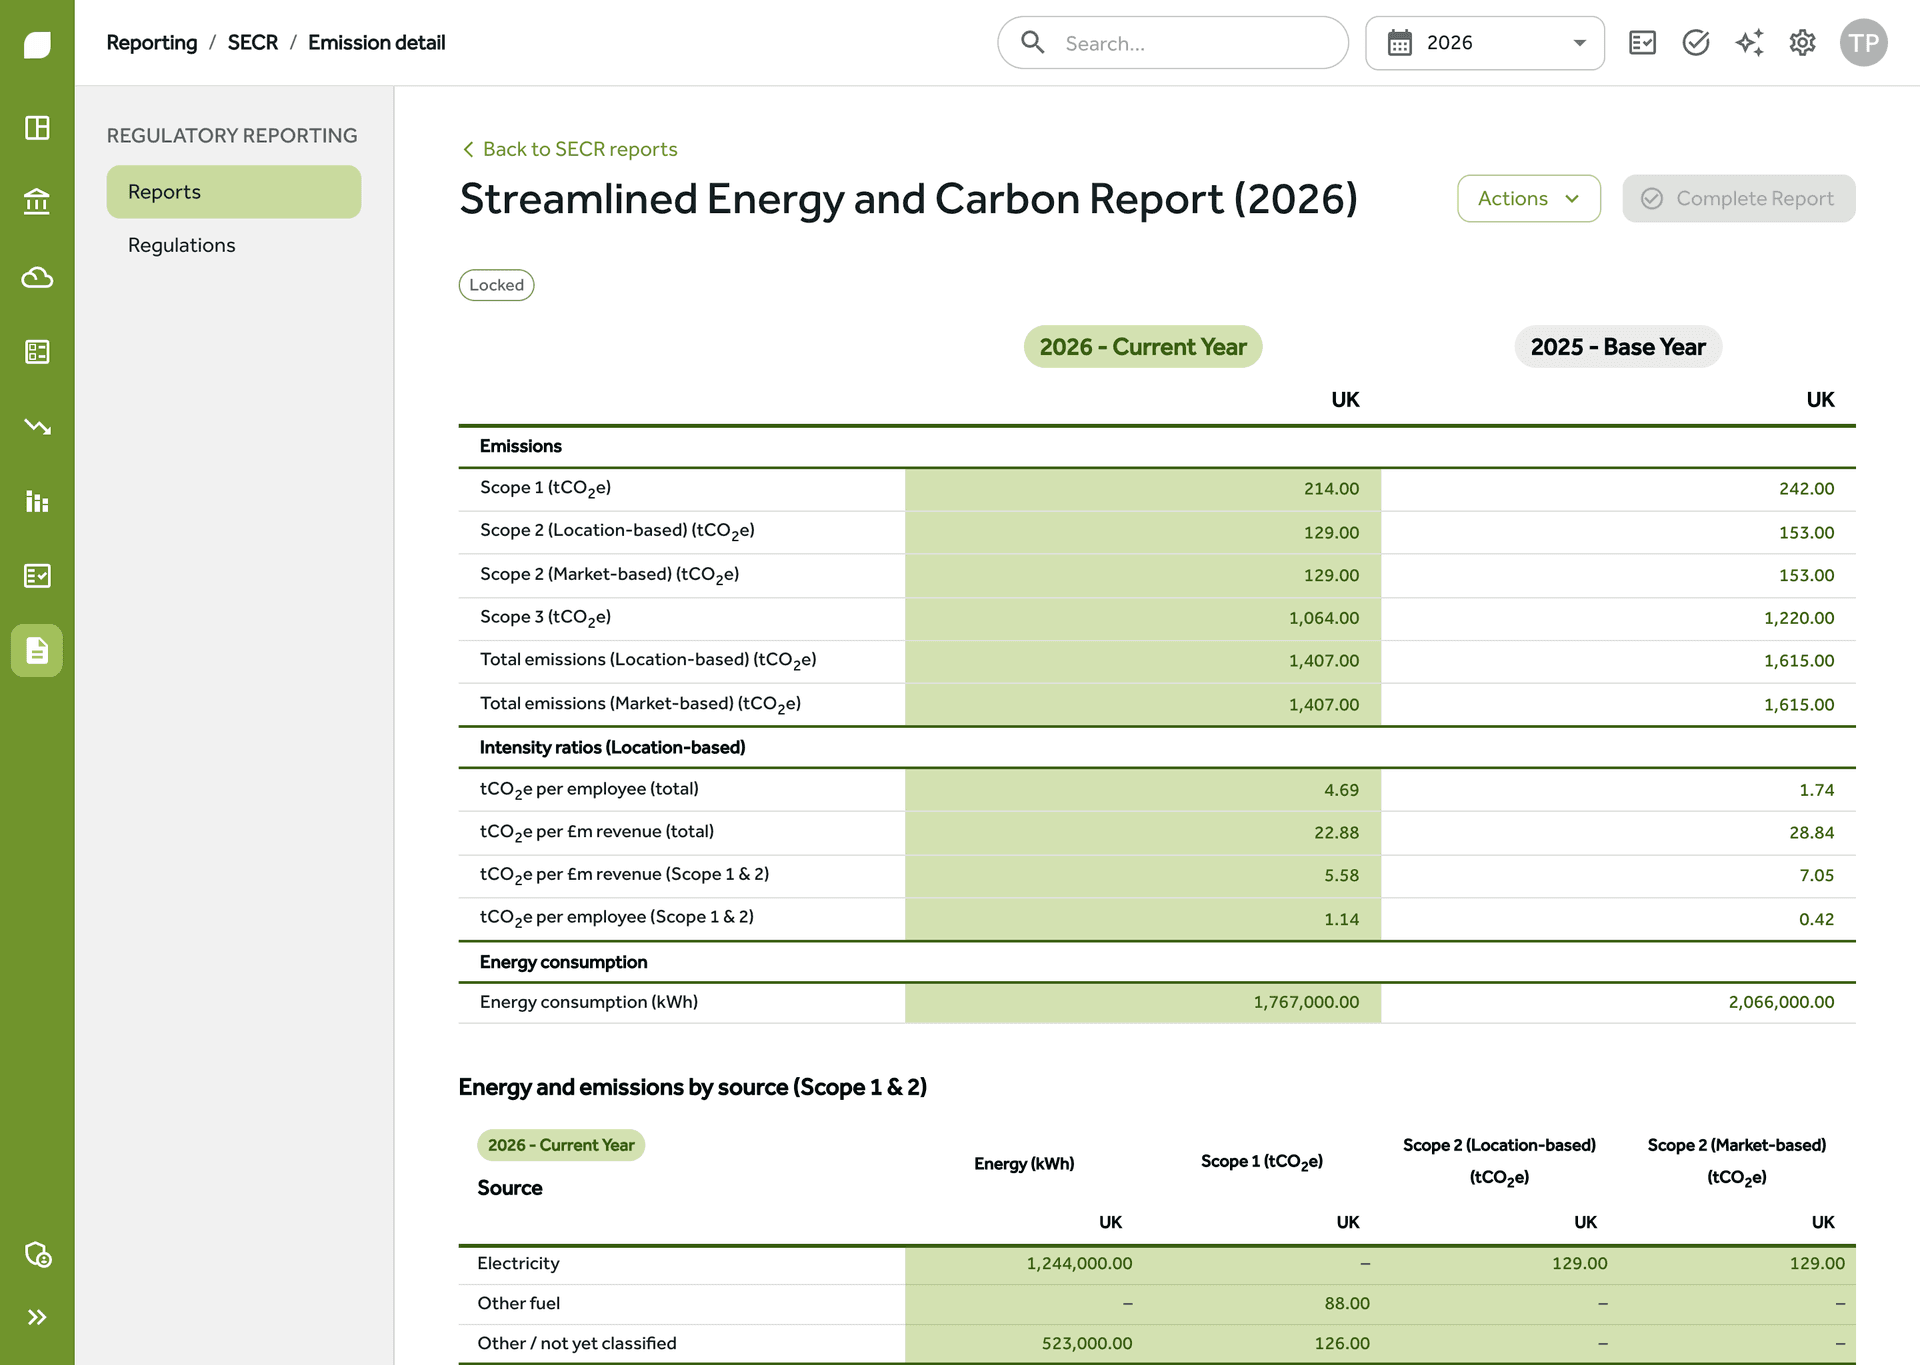
Base year to current year, scope by scope
The GHG Protocol report sets base, previous and current year side by side for every scope, with dual-basis Scope 2 (location-based and market-based), a Scope 3 completeness view across all fifteen categories, GWP and biogenic disclosures, and your consolidation approach stated. The disclosures an auditor looks for are in the document, not in a follow-up email.
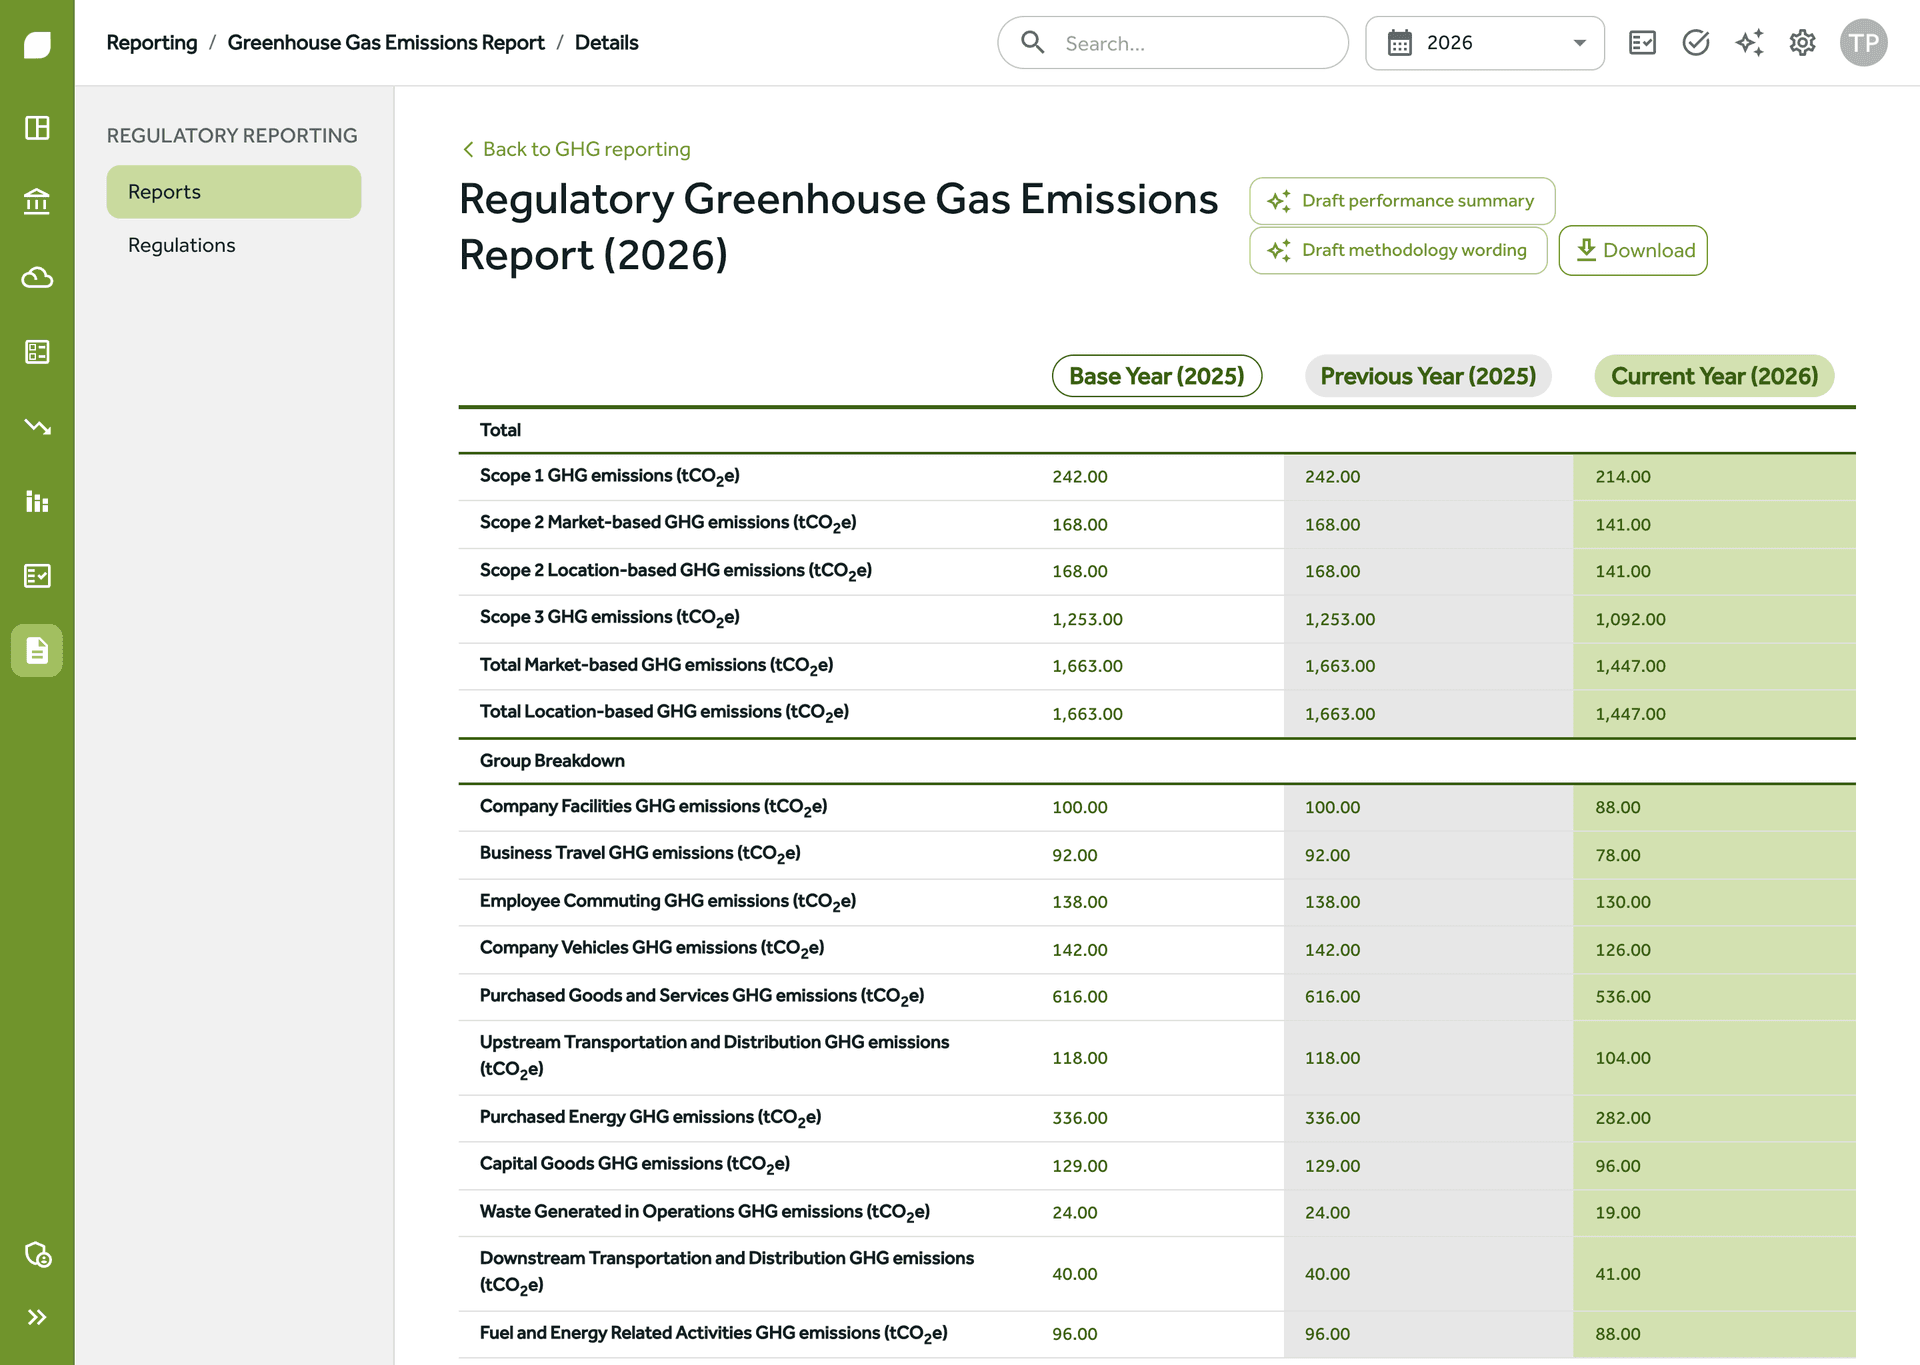
The Carbon Reduction Plan your bid depends on
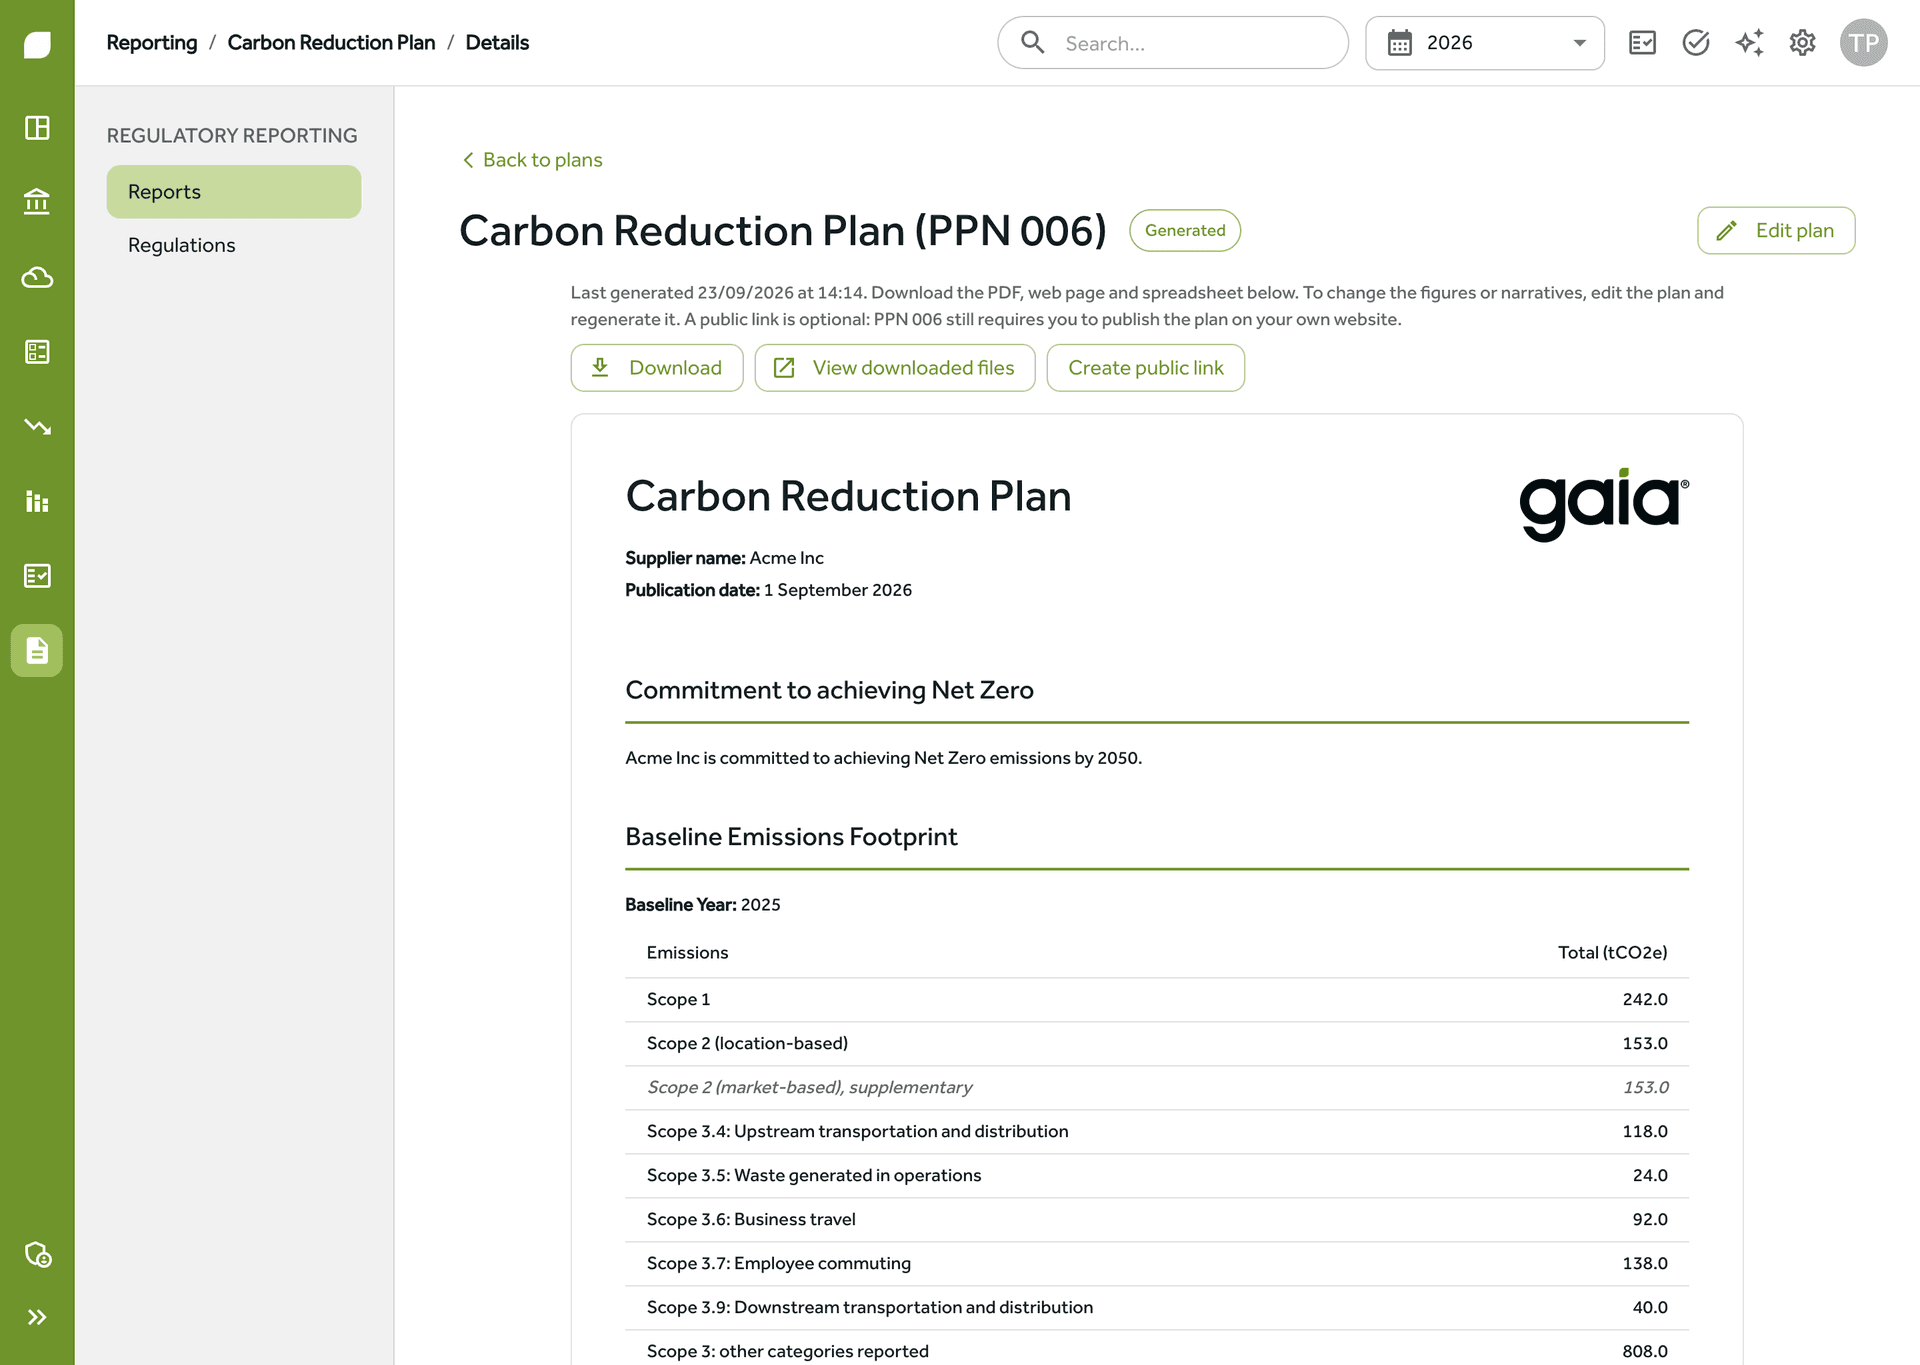
Bidding for central government or NHS contracts means publishing a Carbon Reduction Plan that meets PPN 006. Gaia generates it in the Cabinet Office Annex A structure as a PDF for the bid, a web page you can publish and an Excel workbook of the figures behind it. Generated figures are frozen so the published plan cannot drift, and next year's update regenerates from the data you have been collecting all along. The PPN 006 page covers the requirement in full.
See these reports built from your own data
Reduce and prove: cut emissions and show your workings
Targets with numbers behind them, offsets kept honest, and the evidence pack that stands behind every figure.
A reduction plan with numbers in it
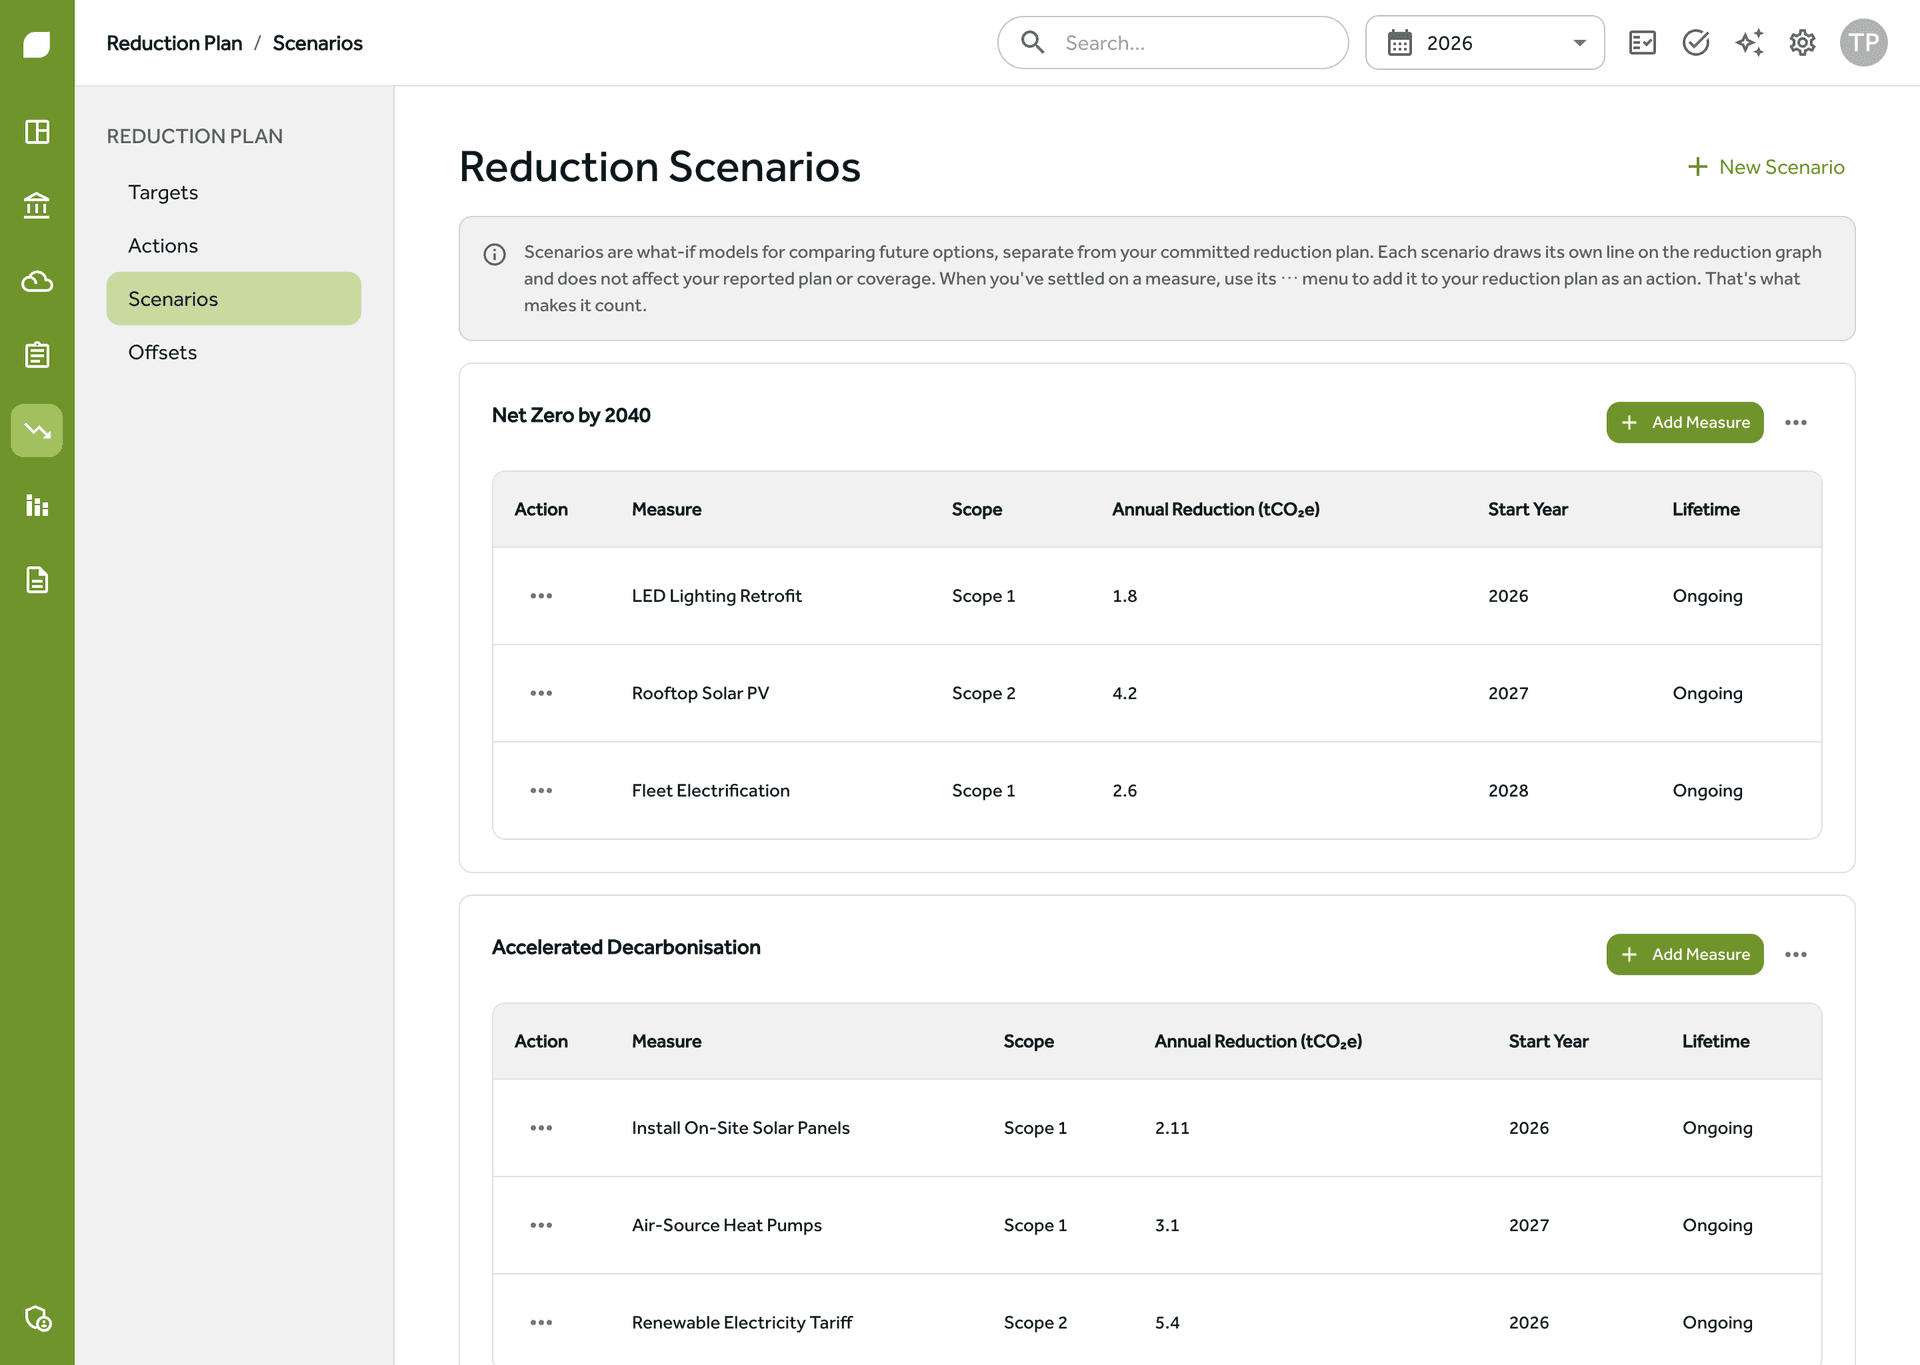
Set reduction targets and a trajectory to 2050, then back them with an action plan of quantified annual reductions rather than a wish list. Scenario modelling compares decarbonisation options, including an all-scenarios-combined view, with per-scenario annual growth assumptions so business-as-usual is not conveniently modelled as a flat line. Scenario modelling is included on the Pro and Enterprise plans.
Gross first, offsets on the record
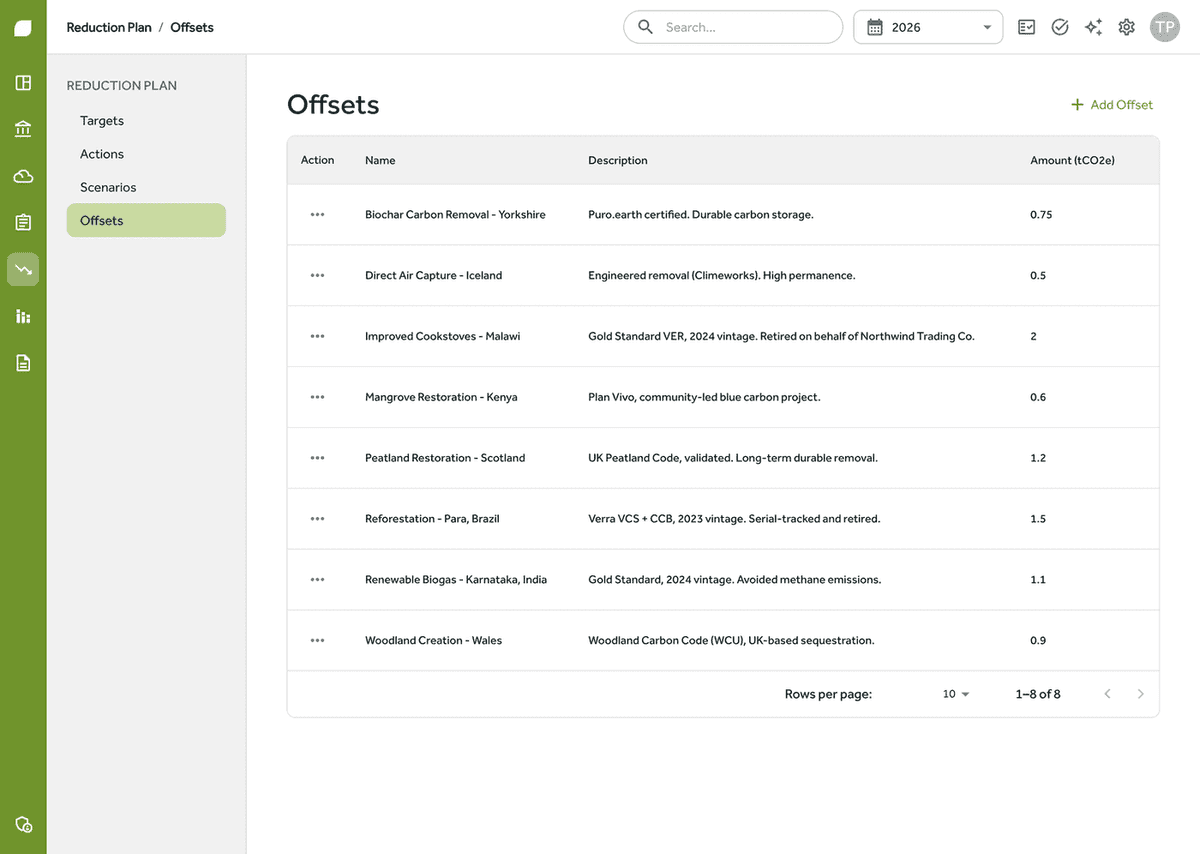
The offsets register records each purchase properly: vintage, registry, serial range and the retirement certificate. Offsets never reduce a scope total. Gross emissions come first, always, with any net position shown as a clearly labelled informational memo, because a footprint that shrinks by purchase is not a reduction. Renewable tariffs and REC certificates are handled within Scope 2 where they belong; they are not offsets and the two never mix.
The artefact your auditor actually wants
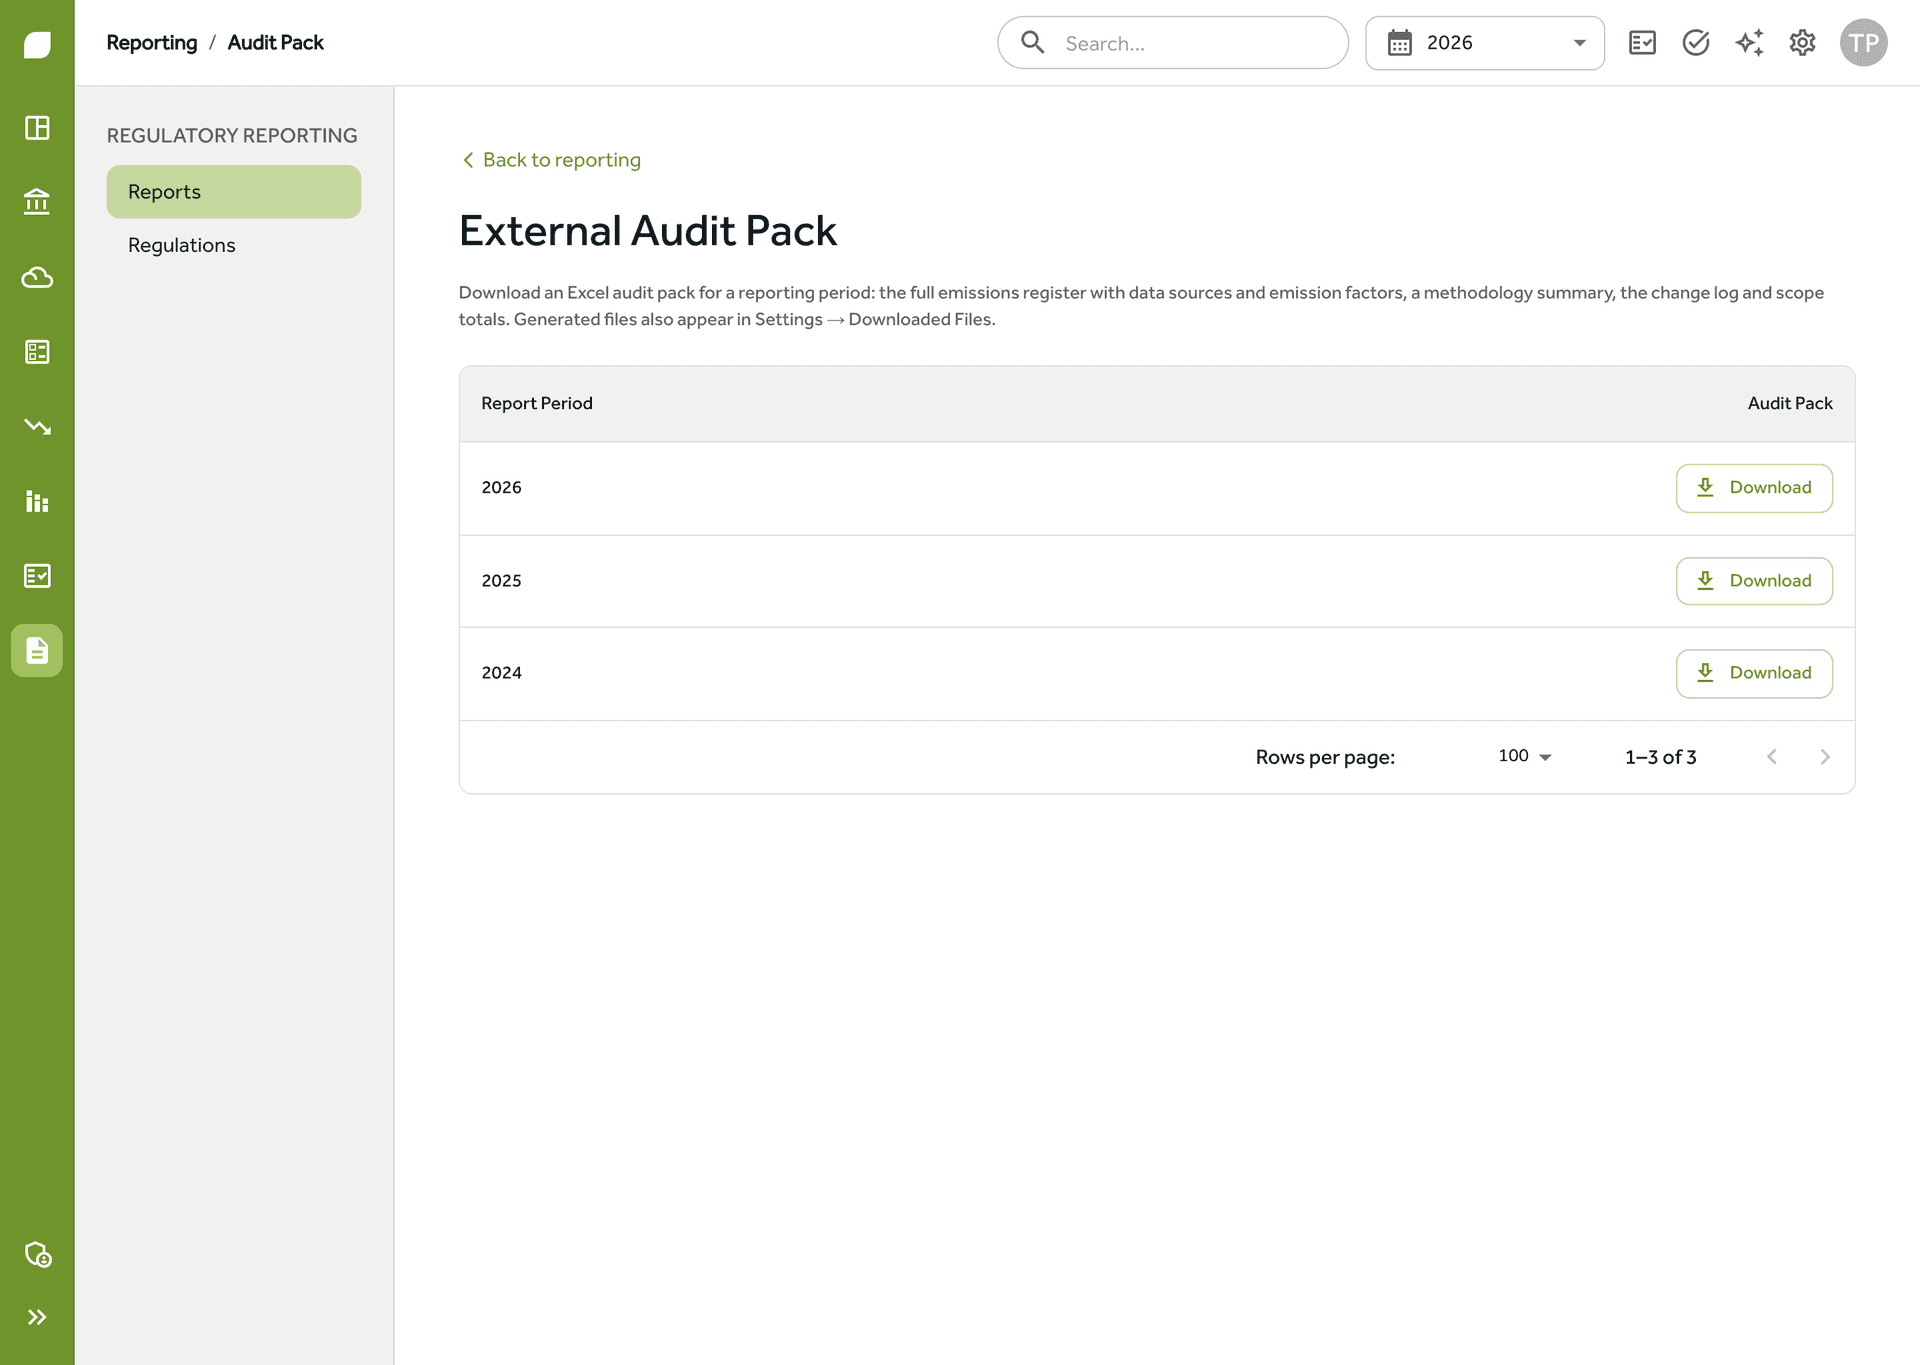
One workbook holds every calculation with the factor applied to it, its data-quality tier, its evidence list, the assumptions register and the factor-year change history. Underneath it, evidence attaches to individual emissions: the bill, the invoice, the certificate, kept with the figure it supports. A field-level audit trail records who changed what and when. This is where the whole walkthrough lands: everything above exists so that this pack holds up when someone checks.
Three rules the platform never breaks
Never a silent zero
Nothing changes under you
Gross first, always
Built on the standards that count
Every number Gaia calculates follows the GHG Protocol Corporate Standard and uses the UK Government conversion factors published each year by the Department for Environment, Food and Rural Affairs (DEFRA) and the Department for Energy Security and Net Zero (DESNZ).
Trusted climate data



Walk through it with your own data
Book a demo and we will follow this exact journey with your numbers, or start a free trial today, with pricing from £300 + VAT per month.